Portfolio Health Check is a concise look at important recent and upcoming events in your portfolio, that clearly identifies strengths, weaknesses, and opportunities. It can be viewed online, downloaded and printed as a 3 page PDF.
Portfolio Health Check Display
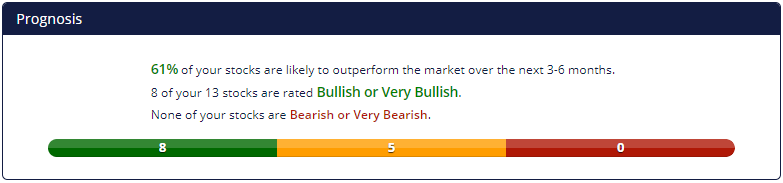
Prognosis
The section describes the overall health of your portfolio, as determined by looking at the percentages of Bullish, Neutral, and Bearish stocks in your list.
Last Week In Your Portfolio
This section recaps events from the previous calendar week, for stocks in your “My Stocks” or any other list at the time the Report was run.
- Stocks with most positive percent change during the previous calendar week (Top 3).
- Stocks with most negative percent change during the previous calendar week (Top 3).
- Stocks whose Chaikin Power Gauge Rating turned Bullish during the previous calendar week (first 9, alphabetically)
- Stocks whose Chaikin Power Gauge Rating turned Bearish during the previous calendar week (first 9, alphabetically)
- Stocks reporting Earnings above the Consensus Estimate* (up to 4 largest positive surprises)
- Stocks reporting Earnings below the Consensus Estimate* (up to 4 largest negative surprises)
- Stocks whose Consensus Estimate* was raised during the previous calendar week (up to 4 largest positive revisions)
- Stocks whose Consensus Estimate* was lowered during the previous calendar week. (up to 4 largest negative revisions)
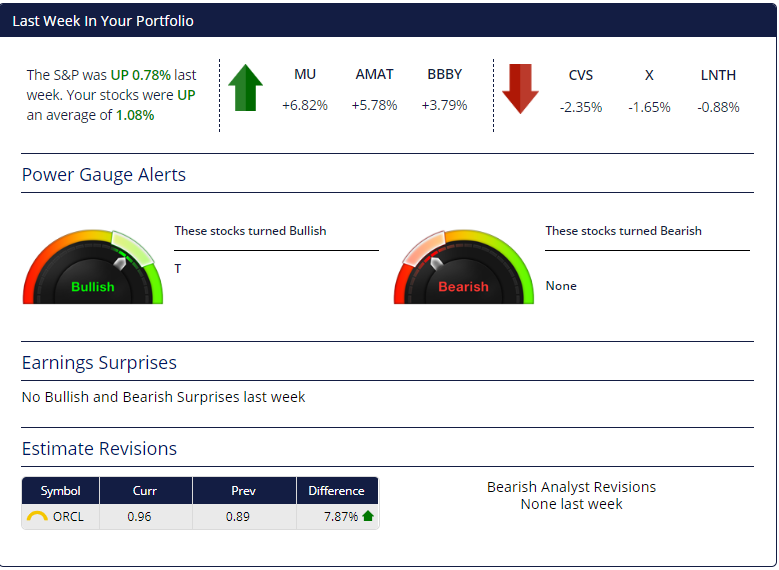
*A Consensus Estimate is a figure based on the combined estimates of the analysts covering a public company. Generally, analysts give a consensus for a company’s earnings per share and revenue; these figures are most often made for the quarter, fiscal year and next fiscal year. The Consensus Estimates used here are earnings estimates for the upcoming quarter.
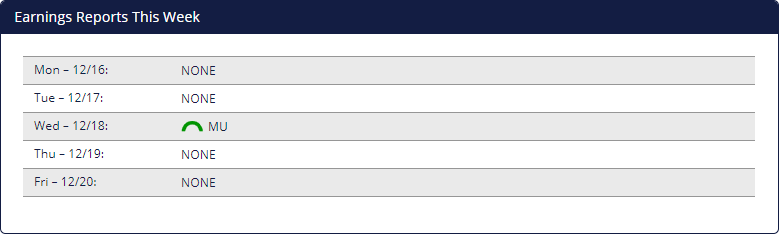
Earnings Reports This Week
This sections is a day-by-day listing of the stocks in your list reporting earnings during the current calendar week, including Chaikin Power Gauge Rating and stock symbol. It is important to be positioned carefully ahead of Earnings, especially if you are holding Bearish rated stocks.
Industry Group Breakdown
The Chaikin Power Grid is one of the most powerful tools in the system. Chaikin suggests an approach of holding strong stocks in strong Industries. The Power Grid plots the stocks in your portfolio with Industries you hold listed strongest at top, weakest at bottom, and stocks displayed along the horizontal axis, weakest to strongest, going left to right.
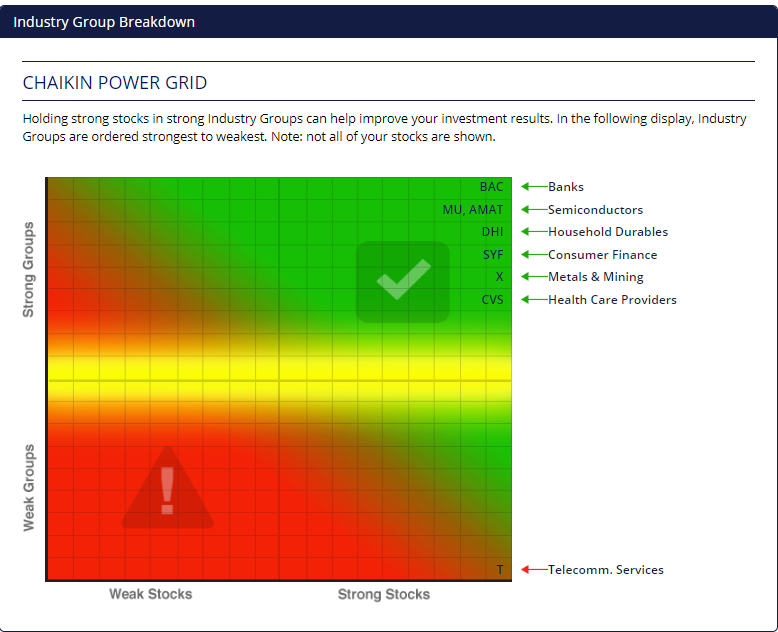
Note: (Not all stocks may be displayed – Neutral stocks or groups may be dropped, and stocks may be dropped if many cluster in the same area of the grid.)
Our backtesting has shown that stocks in the green upper right quadrant (Strong Stocks, Strong Groups), have a significantly higher chance of outperforming stocks in the lower left quadrant (Weak Stocks, Weak Groups), and the market as a whole.
Your Stocks
This section lists all of the stocks in your list, grouped by rating.
- Chaikin Power Gauge Rating
- Stock Symbol
- Last Price, as of end of previous calendar week
- Pct Chg from end of prior week to end of previous calendar week
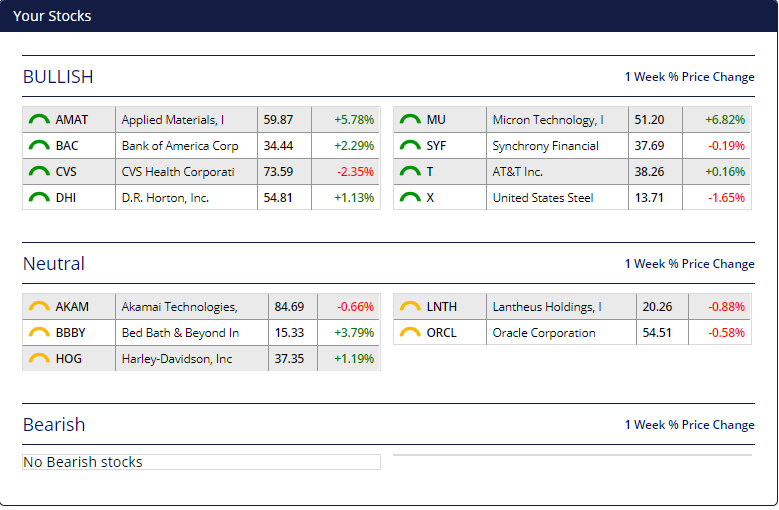
Note: For simplicity of display, Very Bullish are combined with Bullish, Neutral+/- aren’t shown, and Very Bearish are combined with Bearish).