Intraday Chart Popup
Select the “1d” button to toggle the Intraday Chart popup for the current symbol on and off. The intraday chart gives a dynamic visual snapshot of the most recent days’ trading activity.
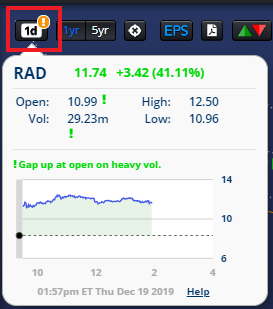
Quote Header
- Symbol, Last, Chg. The Quote Header will display Ticker Symbol along with Last, Change (and Percent Change) colored Green, Red, or Black based on the change relative to the previous Close. Quote information is provided by QuoteMedia. It is reset prior to each market open, and is updated at 1-minute intervals, with no delay, based on trades from the BATS exchange.
- Open, High, Low, Volume Values for the most recent trading day’s Open, High, Low, and Volume are updated at 1-minute intervals, and reflect major exchange information.
Intraday Alerts
You will see colored alert icons (! ! !) next to the Quote fields, accompanied by an Alert message, when certain significant conditions are met.
-
Gap Up/Down at Open A Gap alert will display next to the Open if the stock opens outside of yesterday’s range (i.e. above yesterday’s High or below yesterday’s Low). There will be an actual gap on the historical chart in this case. The alert will display even if the stock’s price has “filled the gap” subsequent to the open.
- Note. The Gap alert is only shown if the stock opens outside of yesterday’s range, not in the case of any difference between previous Close and today’s Open.
-
52-Week High/Low Today – A High/Low alert will display next to the High or Low fields if they meets or exceed the previous 52-week extreme. The alert will display even if the stock has subsequently retreated from its 52-week High/Low.
- Note. – Historical 52-week High/Low is determined based on closing prices only. The stock may have had higher intraday highs, or lower intraday lows over the previous 52 weeks.
- High Volume – A High Volume alert will display if today’s volume is at least 1.5 times the 90 day average volume, as reported by S&P.
The Intraday Alert Message will indicate the conditions triggering today, e.g. “Gap up at open on high volume.” The Intraday Alert icons and message will be colored the same as the change for the day (Green or Red), or Blue if not all conditions agree.
Intraday Chart
On the left, a dot and dotted line indicate the previous Close. The price line shows an up-to-the-minute chart of price activity. The chart is reset prior to market open on trading days, and updates between market hours (from 9:30am to 4:00pm US Eastern time.)
Note: Prices in the chart update at 1-minute intervals, without a delay, based on trades from the BATS exchange, as provided by QuoteMedia. This is the most timely quote we can provide without passing on exchange fees. The intraday chart is not meant for tick-by-tick intraday trading: trades may occur at levels not indicated in the 1-minute updates on the chart, though these would be reflected in the Open/High/Low/Volume fields in the Quote Header.
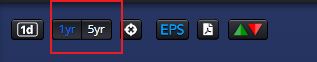
Time Frames
Toggle between 1 year daily and 5 year weekly chart.
Data Window and Crosshairs
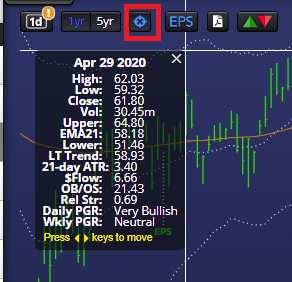
Hold down the left mouse button to see crosshairs and a Data Window showing values of the indicators on the chart for the selected day, including both the Daily and Weekly Power Gauge Rating, volume and values for Upper and Lower Bands, EMA 21, LT Trend, OB/OS, Money Flow, Relative Strength, 21 Day ATR, and Volume . You can move the mouse from day to day.
Note: The historical Power Gauge Rating shown in the data window is the weekly Power Gauge value, i.e. the closing value for the week.
Click the Data Window X icon to toggle the data window on and off. You can then use the left and right arrow keys to move the window one day at a time.
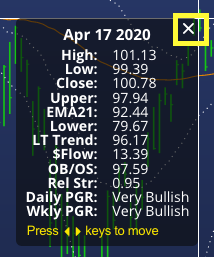
Click the Crosshairs icon to toggle the crosshairs and Data Window on and off. When you are in ‘Crosshair Mode’, you can then use the left and right arrow keys to move the window one day at a time.
Historical Earnings
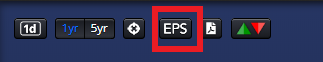
Click the EPS icon on the Chart to see where a company has previously reported Earnings.
At a glance, you can now see not only whether a stock has tended to make or miss expectations, but how the stock reacted soon after each Report. This can be helpful in determining a plan of action around an Earnings Report.
A Green “EPS” icon indicates a report that beat expectations, Red indicates a miss, and Grey indicates expectations met. Hover over an EPS icon to see the quarterly consensus Estimate at the time of the report, actual reported quarterly EPS, and amount by which the company beat or missed expectations.
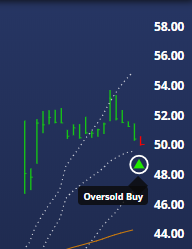
Historical Signals

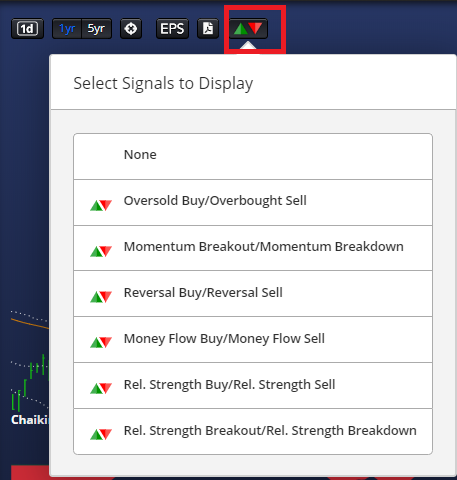
Toggle one of the 6 Chaikin Buy/Sell Signal pairs on or off to see where they triggered historically for the current stock. Green triangles indicate Buy Signals; Red triangles indicate Sell Signals.
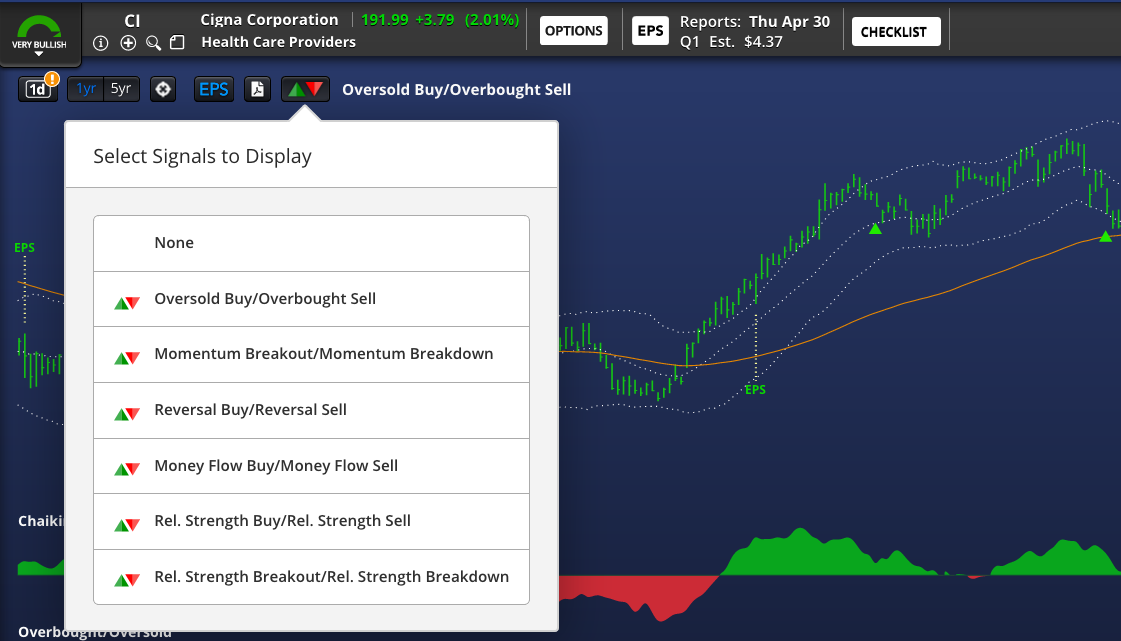
Select a Signal pair once to turn it on, and “None” to turn it off.
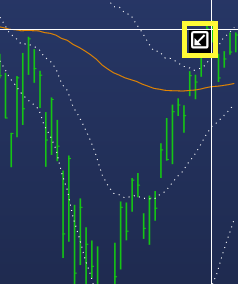
Active Signals

An indication of which Signal or Signals are currently triggered for this stock.
Tap to toggle on or off.
Download to PDF

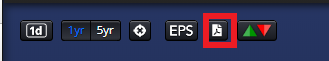
Click the “PDF” icon to download the current chart to a PDF file.
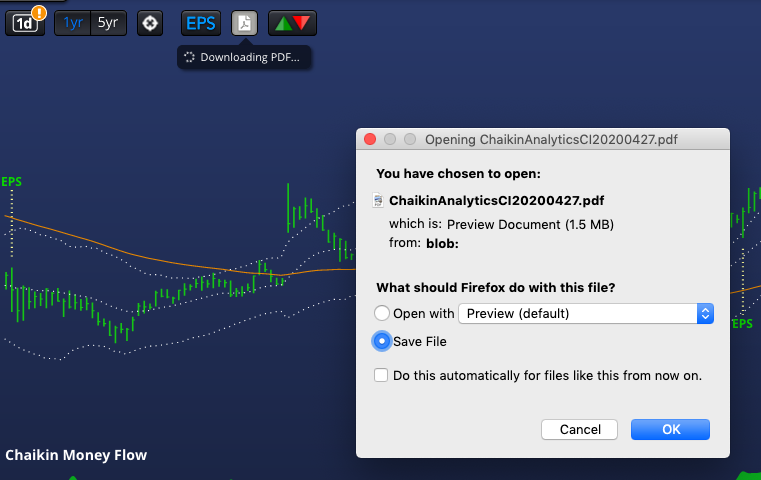
The file will be downloaded to your browser’s default Download location.
The Chart image will be on a white background suitable for printing, and can be resized or edited in any standard PDF viewer or image editing application.