Chaikin Power Gauge Reports are generated daily on over 5,000 U.S. stocks which have a valid Chaikin Power Gauge Rating. They provide a clear explanation of each of the 4 Power Gauge components – Financials, Earnings, Technicals, and Experts. Each component has a section describing how each the factors within it contributed to its Bullish/Bearish value, and has related supporting data and charts not available elsewhere in the application.
For a full explanation of Power Gauge Factors, see the Power Gauge Factor Reference Guide.
Report Display
The Report consists of a section explaining the overall Rating, and sections explaining Power Gauge Components. The Explanation is automatically generated based on logic which summarizes the most important elements.
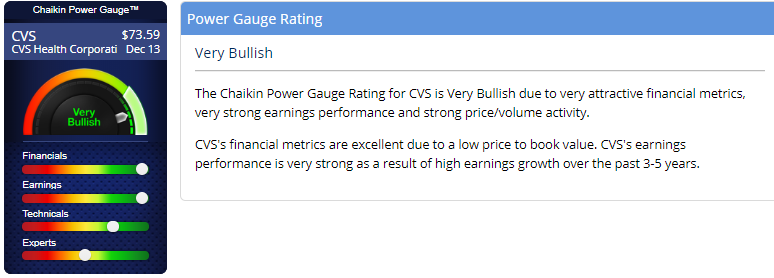
Power Gauge Rating
This section explains the Power Gauge Rating assigned to the Stock. (Power Gauge Reports are not currently available for ETF's)
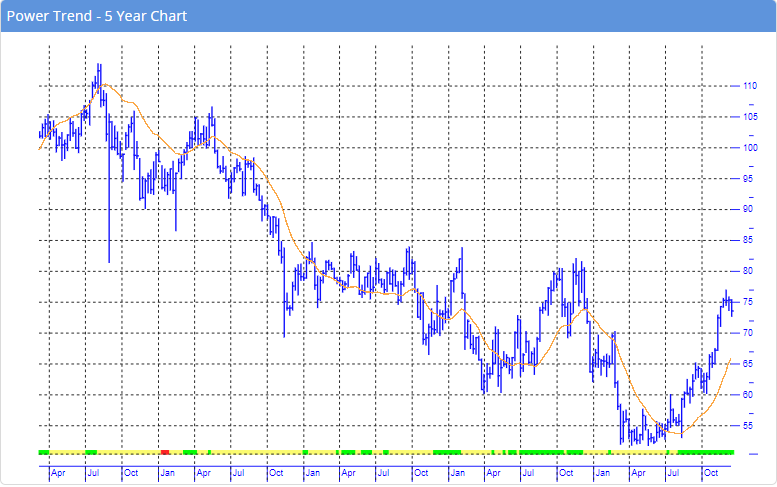
Power Trend - 5 Year Chart
This is a 5 Year Chart, with the Long Term Trend (orange line) included as well as the Power Gauge Rating displayed as a ribbon along the bottom of the chart.
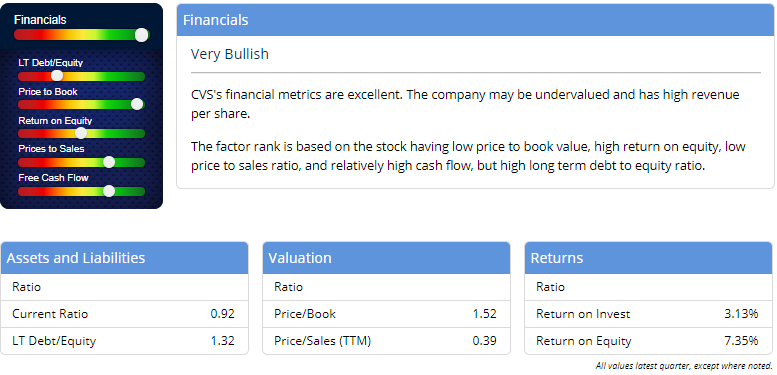
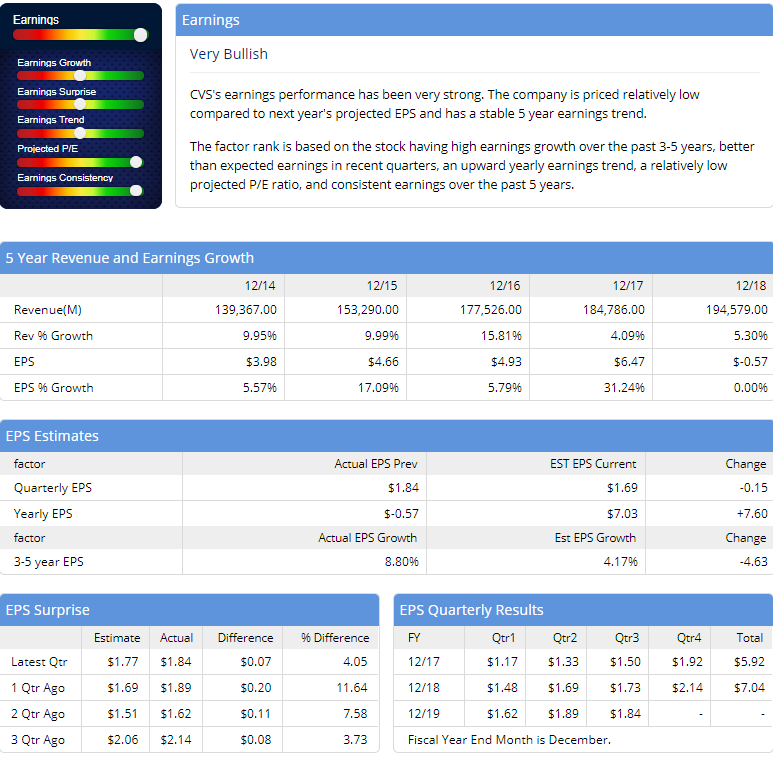
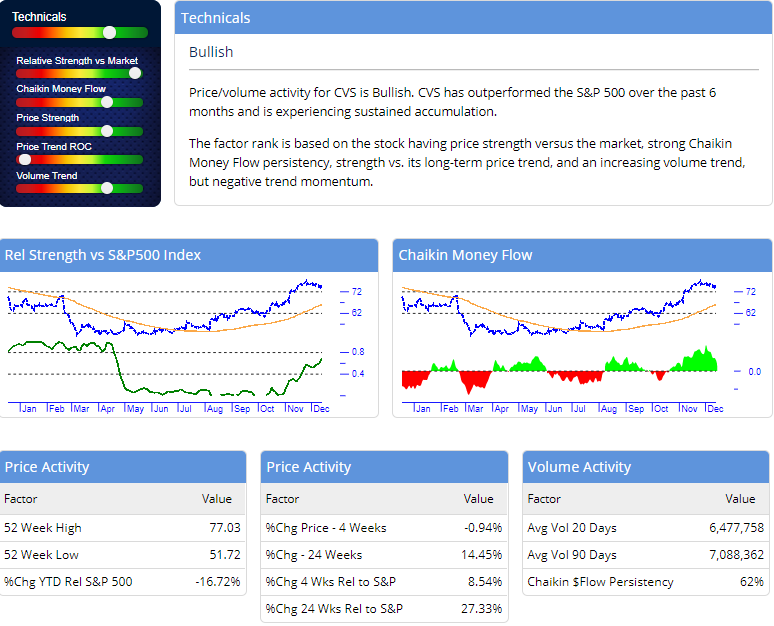
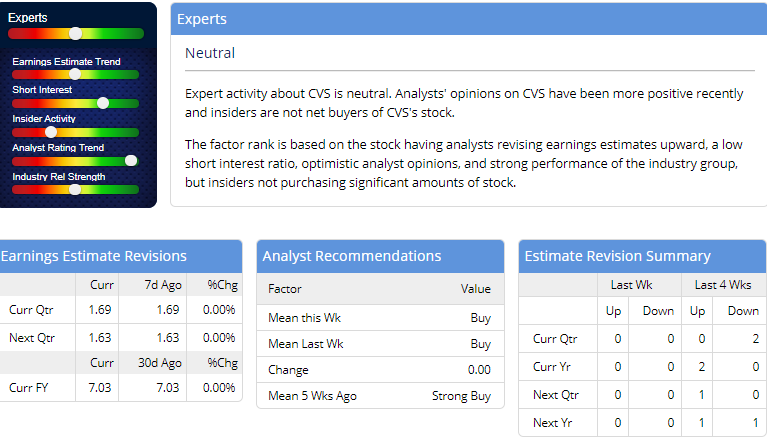
The report also includes sections on each of the 4 Power Gauge Factors, Financials, Earnings, Technicals, and Experts. For each of the 4 Factors, in addition to the graphical representation, specific values are provided.
Financials
Earnings
Technicals
Experts
Content Notes
Notes on Data Sources
Data internal to the Chaikin Power Gauge model is sources from our model vendor Portfolio 123, which in turn sources fundamental information from S&P Compustat (including Industry classifications).
Data and Industry Groups displayed in the Report body itself, and in the Chaikin Analytics application are sourced by Chaikin directly from S&P.
Both of these are reputable, high-quality content sources, however there may be occasional slight differences due to financial accounting methods or Industry classification schemes.
Notes on Power Gauge Factors
The Power Gauge is designed as an indicator of likely relative performance over 1-6 month time frame. As such, all Component and Factor values are scaled relative to a comparison group – which is either the stock’s Industry Group or the overall market (the Russell 3000), depending on the factor, as listed in the Power Gauge Factor Reference Guide.
If you look closely at factor values, you may notice some seeming idiosyncrasies. Here are some things to keep in mind:
- A factor may have what seems like a “high value” but it may not be so high when ranked relative to its comparison group.
- Some factors – such as “Analyst Earnings Trend – look at the direction of a metric, rather than its absolute value. In these cases the current value may be high, but the factor value may score low because its trend has been down more than others in its comparison group.
- The “Technicals” Component looks at 5 price/volume-related factors, again all scaled relative to others in the market. This is not the usual way that technicals are considered, but it is appropriate and most effective in the Power Gauge model. So for instance, a stock could have what seems like a strong position relative to its trends, but not rank high in times of strong overall market uptrends.
- All factors in the Power Gauge have been normalized so that GREEN IS GOOD and RED IS RISK. If a factor value says “Bullish” this means that it is strong relative to its comparison universe. For most factors, a high absolute value is good. But for some, such as “Short Interest”, the inverse is the case – a high value is a Bearish indication. Again, in all cases: Green is Good.
- All language used in the Explanations describes these relative factor values. So if the Explanation says a stock has a “high price to book value”, this means the value is high relative to its comparison group.