Please note: Analytics is not yet supported on mobile versions of the site. It is accessible via the desktop and iPad versions of the site.
Once you sign into Chaikin Analytics you will land on our Dashboard. You may quickly navigate to any other part of the Chaikin Analytics Platform by simply clicking on the desired function in the top menu bar. For example, clicking on Workspace will bring you back to the previous landing page.

The Dashboard consists of three Elements, a Price Movement display based on User, Industry, Index and ETF Lists, a Chaikin Ideas Section to help with stock selection and evaluation; and a Commentary where you can easily view the current week's Morning Insights and Market Insights publications.
Price Movement Display:
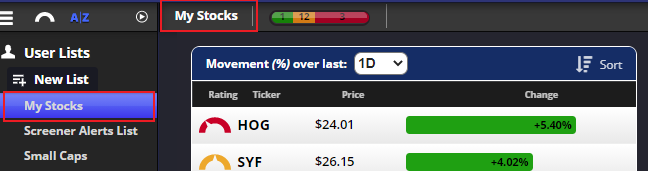
User Lists:
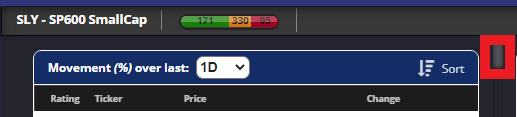
This Display Defaults to the User List 'My Stocks' and will dispaly the stocks in that list. You can easily change the list displayed by simply clicking on another list in the User List Section along the Left Margin. The active list shows aloing the menu bar along with the Power Bar for that list. Note that prices are updated on the dashboard as frequently as they are elsewhere in the platform. Using the sort button, you sort the symbols in any List by Power Gauge Rating (Strong/Weak or Weak/Strong), Symbol (A/Z or Z/A), Percent Change (High/Low or Low/High), or Price (Low/High or High/Low).
You may also make additional selections from the User Lists Menu.
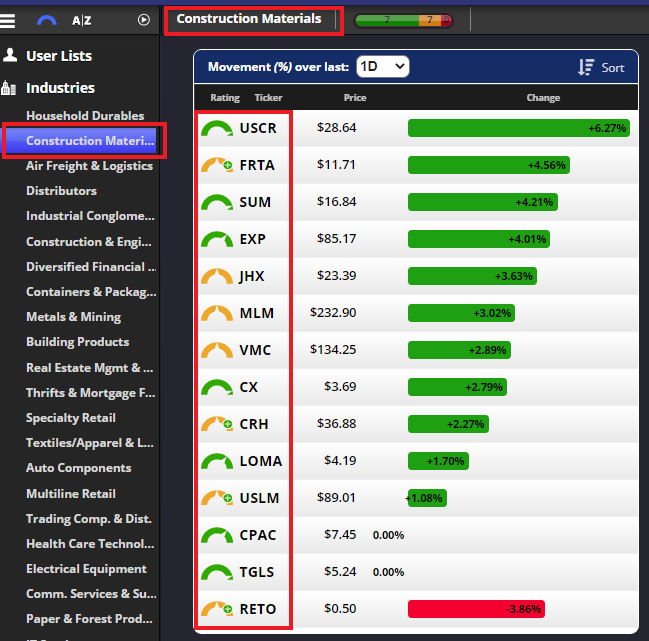
Industries:
By clicking on Industries along the Left Margin, you may open the list of Industries. You may then click on an individual Industry and the table will show those stocks associated with that Industry. In the picture below, Construction Materials was selected as the Industry, and the display shows stocks in that Industry. Using the sort button allows you to sort the individual equities in each Industry in the same manner you can individual equities in User Lists.
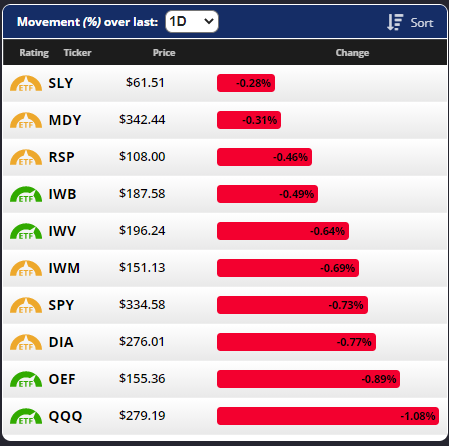
Indices:
There are two ways to view this information. First, you may create a list containing those ETF's that we use as proxies for the major indices. To populate your list with just the indices themselves, click on the icon shown in the picture below and you will populate the window with just the ETF's representing the Indices.
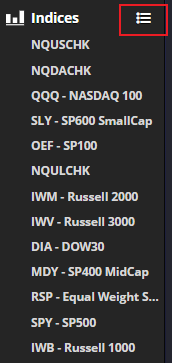
You may also populate this list with the Individual Equities in each of these Index ETF's.
Simply select the Index you are interested in, click on it, and the constituent stocks making up that Index will appear in the Table. To view all the stocks in a larger Index, use the scroll bar located at the top right corner of the List.
The same sort functions exist in this part of the Dashboard as exist in the User List Section.
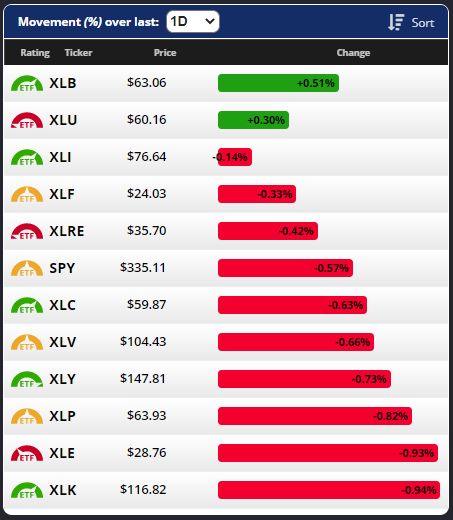
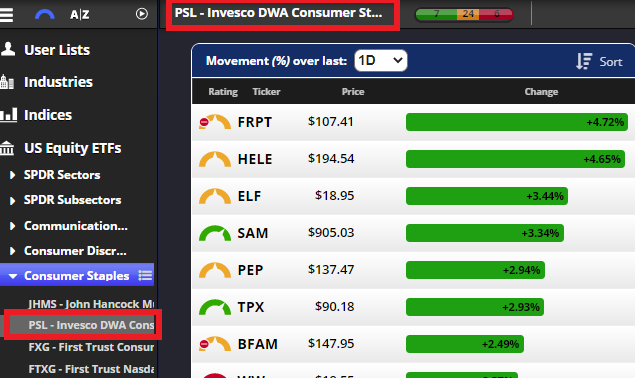
U.S, Equity ETFs:
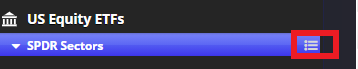
You may populate the list with ETFs in any of the categories contained in the Menu. For example, by selecting Sectors and clicking the icon shown in the picture, your list will populate with the individual Sectors.
Use this same process for each of the ETF Categories, including Sectors, Subsectors, and the ETFs similar to the SPDR ETFs.
In the picture below, you can see that by clicking on the down arrow next to Consumer Discretionary, I have expaned the list to include covered ETFs in the Consumer Discretionary Area. Clicking on the icon at the left will populate the list with those individual ETFs.
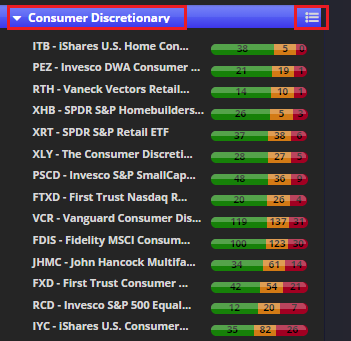
You may also view the individual stocks in a rated ETF by selecting the ETF you wish to view from the menu on the left side.
You may view the selected List in the dashboard over varying time periods including the current day, 1 Week, 1 Month, 3 Months, 6 Months, and One Year. The default view is the current day.
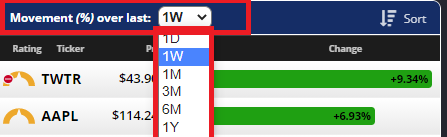
You may also sort the stocks in the list by Rating (strongest to weakest or weakest to strongest), by Symbol (A-Z or Z-A), % Change (gain on top or losers on top), and by Price (High to Low or Low to High). Use the Sort Button at the top right of the display to sort.
Chaikin Ideas:
Chaikin Ideas are lists of equities or ETF's based on certain criteria. These lists are updated daily. They are also displayed in Chaikin Hot Lists where they may be copied into a User List, against which screens can be run.
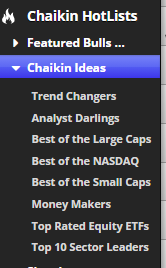
Best of the NASDAQ: Top bullish stocks in the Nasdaq index (ETF: QQQ) by YTD performance. Stocks will be in a strong industry with at least 1 month relative strength persistency, and 100,000 shares trade volume. These stocks are also optionalble.
Best of Large Caps: Strongest stocks in the S&P 500 index (ETF: SPY) combining Power Gauge Rating, industry strength, and technical strength. Stocks will also have at least 1 month relative stregnth persistency and 100,000 shares trade volume. These stocks are also optionable.
Best of the Small Caps: Strongest stocks in the Russell 2000 Small Cap index (ETF: IWM) combining Power Gauge Rating, industry strength, and technical strength. Stocks will also have at least 1 month relative stregnth persistency and 100,000 shares trade volume. These stocks are also optionable.
Money Makers: Strongest stocks in the Russell 3000 (ETF: IWV) with strong cash flow and price/sales. Stocks will be in a strong industry with at least 1 month relative strength persistency, and 100,000 shares trade volume. These stocks are also optionalble.
Analyst Darlings: Strongest stocks in the Russell 3000 (ETF: IWV) with with recent increase in Bullish analyst activity. Stocks will be in a strong industry with at least 1 month relative strength persistency, and 100,000 shares trade volume. These stocks are also optionalble.
Trend Changers: Stocks that have a change in Power Gauge, Money Flow, and Relative Strength that may signal the beginning of a new trend. Stocks will be in a strong industry and have at least 100,000 shares trade volume. These stocks are also optionalble.
Top Ten Sector Leaders: Top US Equity Sector and Industry ETFs. ETFs will have at least 1 month relative strength persistency, and 100,000 shares trade volume.
Top Rated Equity ETFs: Top ranked Equity ETFs with at least $100m of AUM regardless of sector. ETFs will have at least 1 month relative strength persistency, and 100,000 shares trade volume.
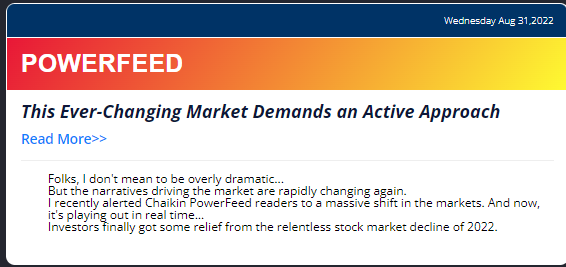
Today's Commentary:
This section allows you to read the current trading day's issue of PowerFeed. Simply click the 'Read More' icon and the current issue will display in a new browser window.
You may also view previous issues of Market Insights. Click on the 'Read More' icon and the older issues will load a page containing links to previous Market Insights, and PowerFeed.