An Overview of the Chaikin Analytics Chart
The Chaikin Chart is your main view for analyzing a stock’s technical, fundamental, and sentiment signals. It brings together multiple proprietary indicators into one screen to help you make better-informed decisions.
This article is ideal for new users looking to understand what they’re seeing on the chart and how to use it effectively.
Here's an interactive walkthrough of the Chaikin Chart
** Best experienced in Full Screen (click the icon in the top right corner before you begin) **
8 STEPS
Main Areas of the Chaikin Chart
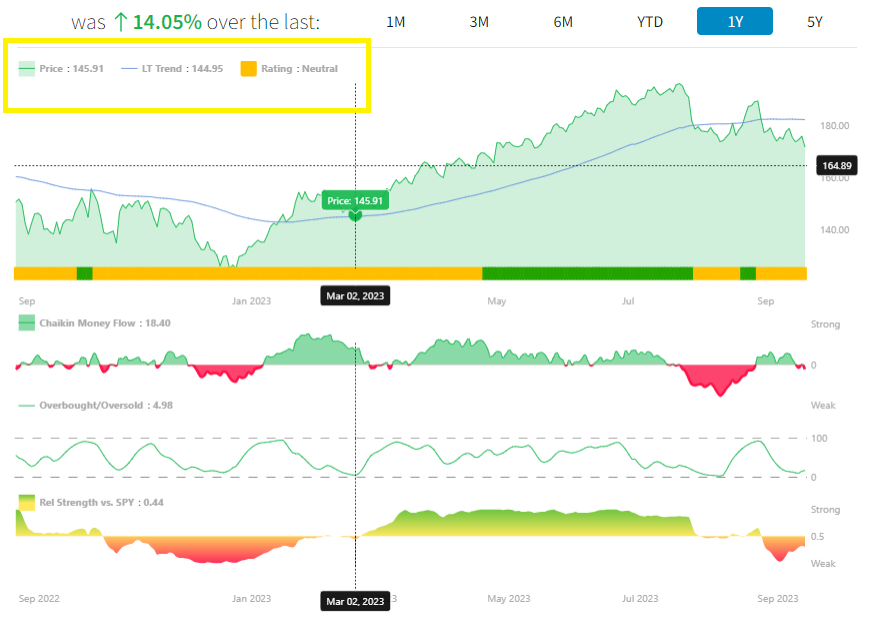
Date-Based Information
As you move your mouse across the chart, you’ll see specific dates appear. These dates correspond to details in the top left corner of the chart—including the price, the long-term trend, and the Power Gauge Rating.
- On 3-month, 6-month, Year-to-Date, 1-year, and 5-year charts: the rating shown is the Weekly Average Rating.
- On the 1-month chart: the rating shown is the Daily Power Gauge Rating.
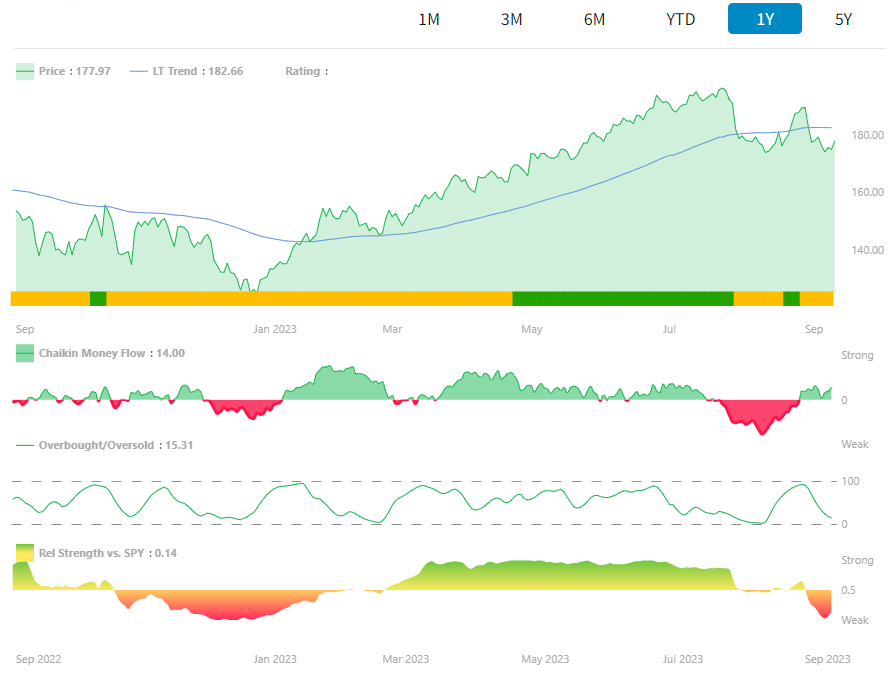
Historic Price Chart
This is the main price display, showing the stock’s adjusted closing price over time. Adjustments include corporate actions like splits.
- The blue line running through the chart is the Long-Term Trend, based on a proprietary 200-day moving average calculation.
- This helps you see whether the stock has been in a sustained uptrend or downtrend.
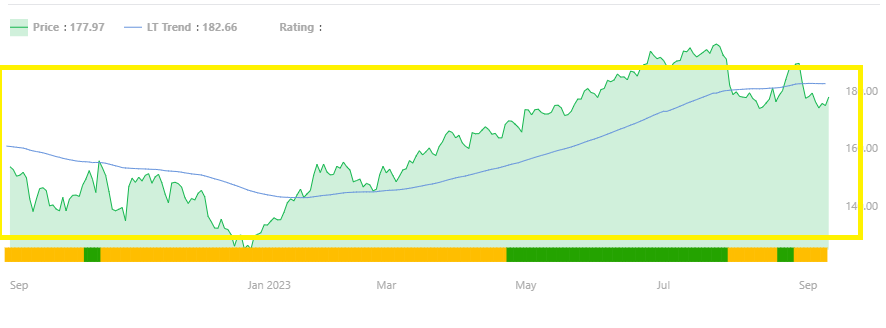
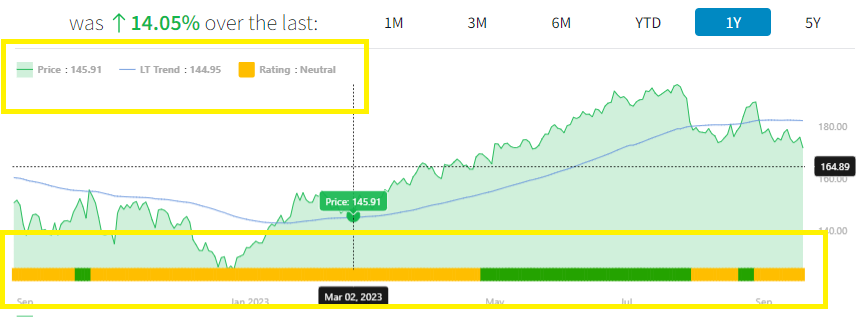
Power Gauge Trend
This section shows the Weekly Average Power Gauge Rating as a timeline of color-coded boxes:
- Green = Bullish
- Yellow = Neutral
- Red = Bearish
Hovering over a box reveals the specific rating for that week. This provides a visual history of the stock’s rating changes.
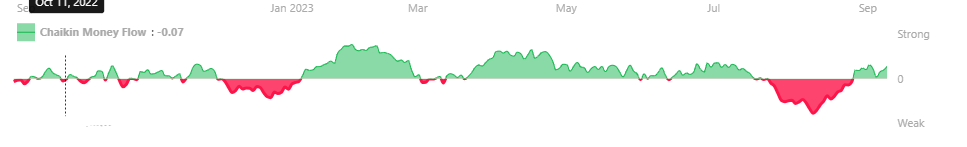
Money Flow
Chaikin Money Flow (CMF) is a financial metric used in technical analysis that measures the net accumulation (in green) or distribution (in red) of assets. CMF's scale ranges from +100 to -100:
- A score of +100 indicates consistent daily high closes over a 21-day period, signaling strong buying interest.
- A score of -100 reflects consistent daily low closes, indicating strong selling pressure.
- Scores above +25 or below -25 typically highlight strong accumulation or distribution trends.
Chaikin Money Flow acts as a proxy for institutional investor behavior, providing insight into whether large investors are quietly buying into (or exiting) a stock.
Sustained green CMF bars suggest accumulation (buying pressure), while red bars suggest distribution (selling pressure).
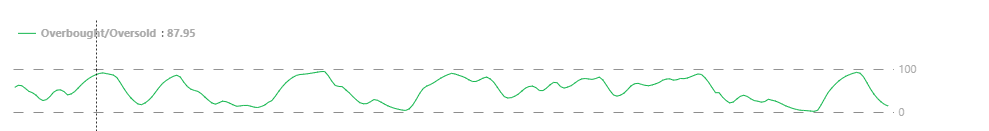
Overbought/Oversold (OB/OS)
This indicator offers a clear, refined depiction of a stock's position within its typical trading range. The term "overbought" refers to a situation where a stock's price has experienced an excessive increase beyond what is supported by its technical analysis context, whereas "oversold" indicates the opposite scenario.
The Chaikin OB/OS rating offers a refined and standardized assessment of where a stock stands within its typical trading range. This rating employs a scale ranging from 1 to 100:
- Values of 70 or above are considered "Overbought."
- Values of 30 or below are considered "Oversold."
When the OB/OS indicator falls below 30 and subsequently reverses course upward, it can serve as a favorable entry point—especially when corroborated by the Power Gauge. An overbought condition is typically associated with a reading above 70 and may indicate the stock is due for a pullback.
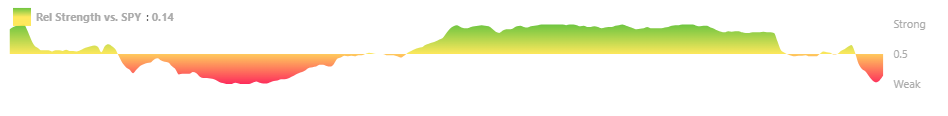
Relative Strength
This indicator gives a reliable signal of how a stock is doing compared to the S&P 500 index. When it turns green, it means the stock is performing exceptionally well compared to the overall market.
On most charts, Relative Strength compares the selected stock to the S&P 500. On the SPY chart, however, it compares SPY to IWV—the iShares Russell 3000 ETF—providing a broader look at market performance across large-, mid-, and small-cap stocks.
Periods of strong or weak relative strength often signal a shift in how the market views a stock, even before the Power Gauge Rating adjusts.
Why the Chart Matters
Each of these tools helps you understand a different part of the story. Used together, they give a fuller picture of the stock’s condition.
🧩 These indicators also power tools like the Pre-Trade Checklist and Screener filters.
📊 Want to find stocks already meeting strong technical setups? Start with the Preset Screens in the Screener.
Want More Charting Features?
In addition to the standard Chaikin Chart, we also offer an Advanced Chart with expanded charting tools and customization options. This version includes more detailed overlays, flexible timeframes, and enhanced technical views.
The Advanced Chart is available to all Power Gauge PRO subscribers and above.
📘 Learn more here: How to Use the Advanced Chart
Viewing the chart in the Analytics platform?
You're likely using our legacy version. Learn how to read the Analytics chart here ›.