To generate the Health Check of any of your list first select the list you would like view using the drop down menus at the top of the page. 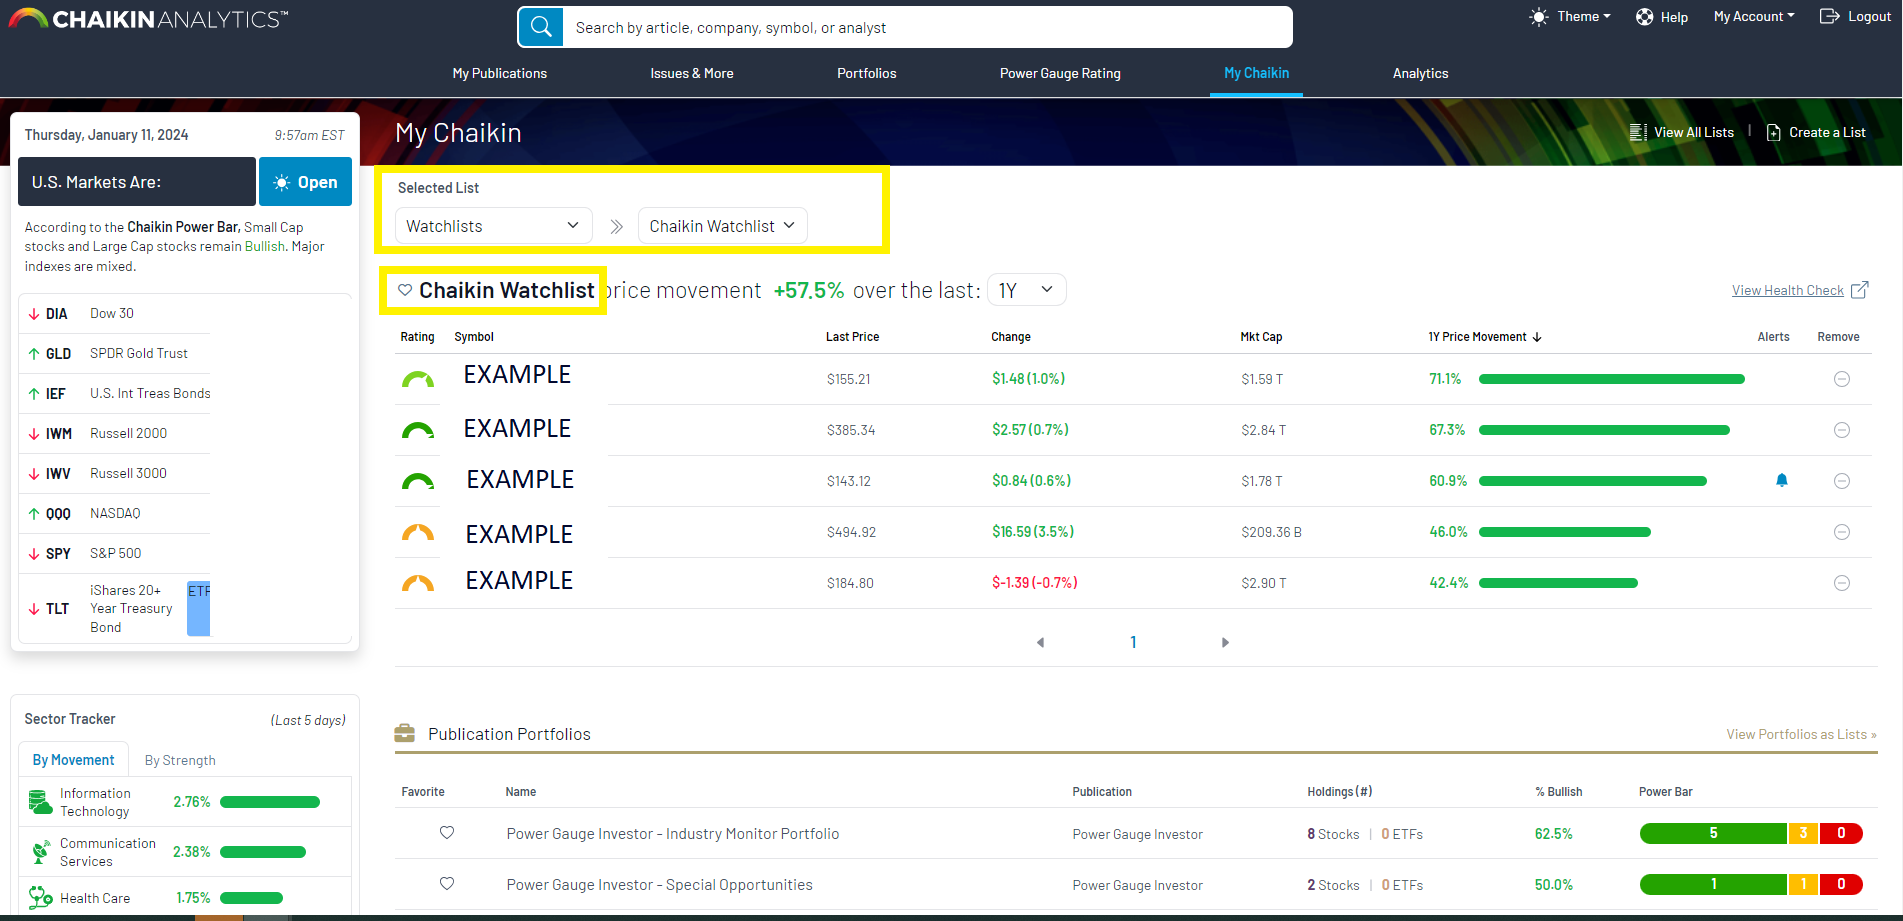
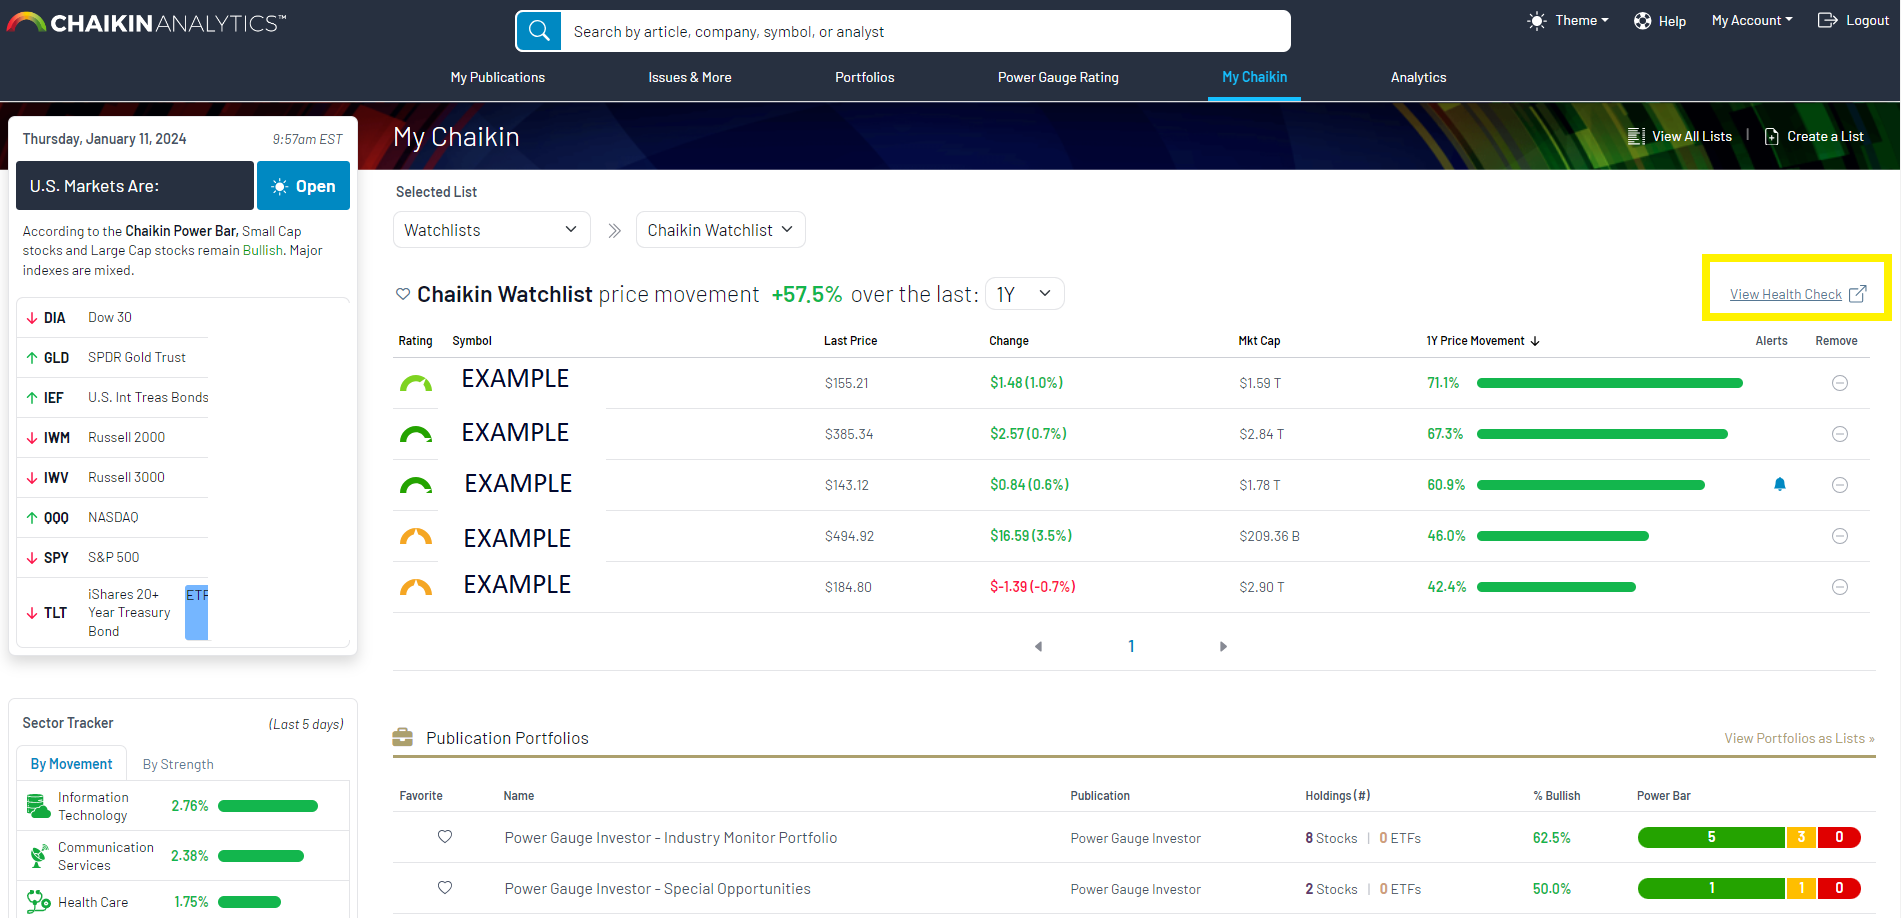
Then Select the View Health Check button.
Here you will be able to:
- View the Chaikin Power Bar for the list as well as the list make-up
- View/add a list description or note
- View basic alerts for any symbol on the list
- Compare the list performance to a selected benchmark
- View the price movement (performance) of the list over 1 day, 1 month, 3 months, 1 year, or 5 years
- View past of upcoming earnings
- View the industries represented in the list (Industry Exposure)
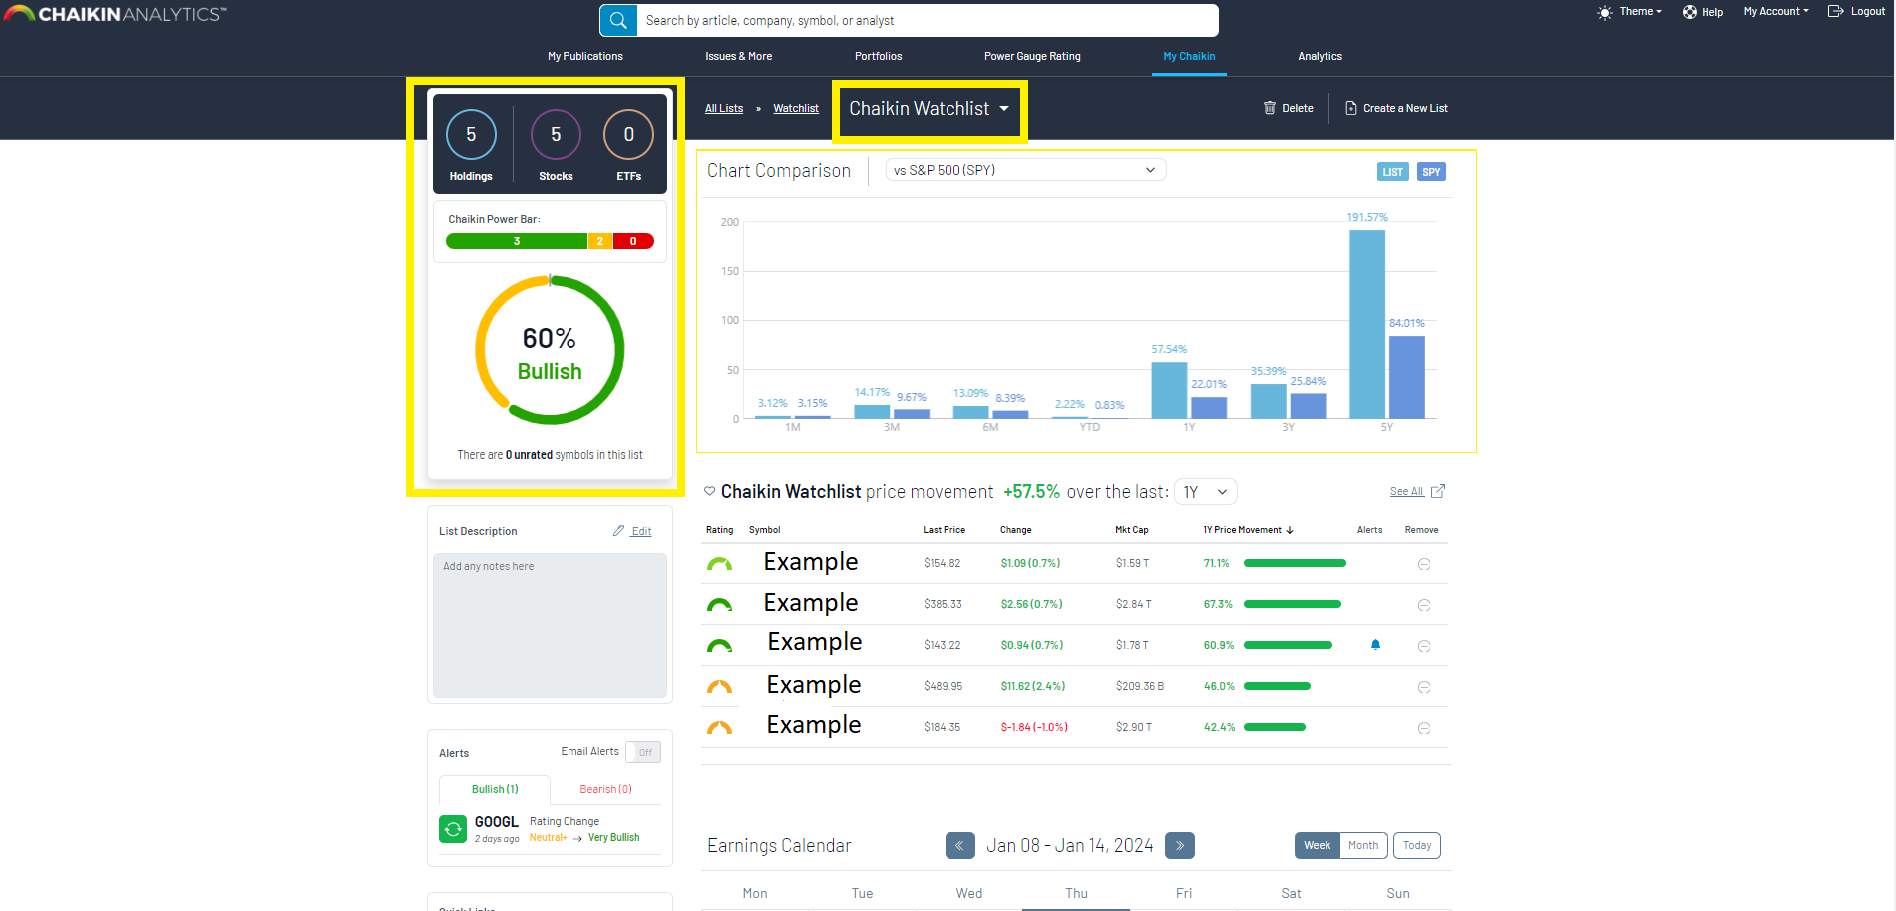
List Power Bar and Summary
The Chaikin Power Bar tells the number of bullish (including very bullish), neutral, and bearish (including very bearish) symbols in the selected list.
In addition to the Power Bar, you will be able to see how many symbols/holdings are in the list and whether they are stocks vs ETFs. You will also see the percentage of bullish symbols and if any of the symbols are unrated.
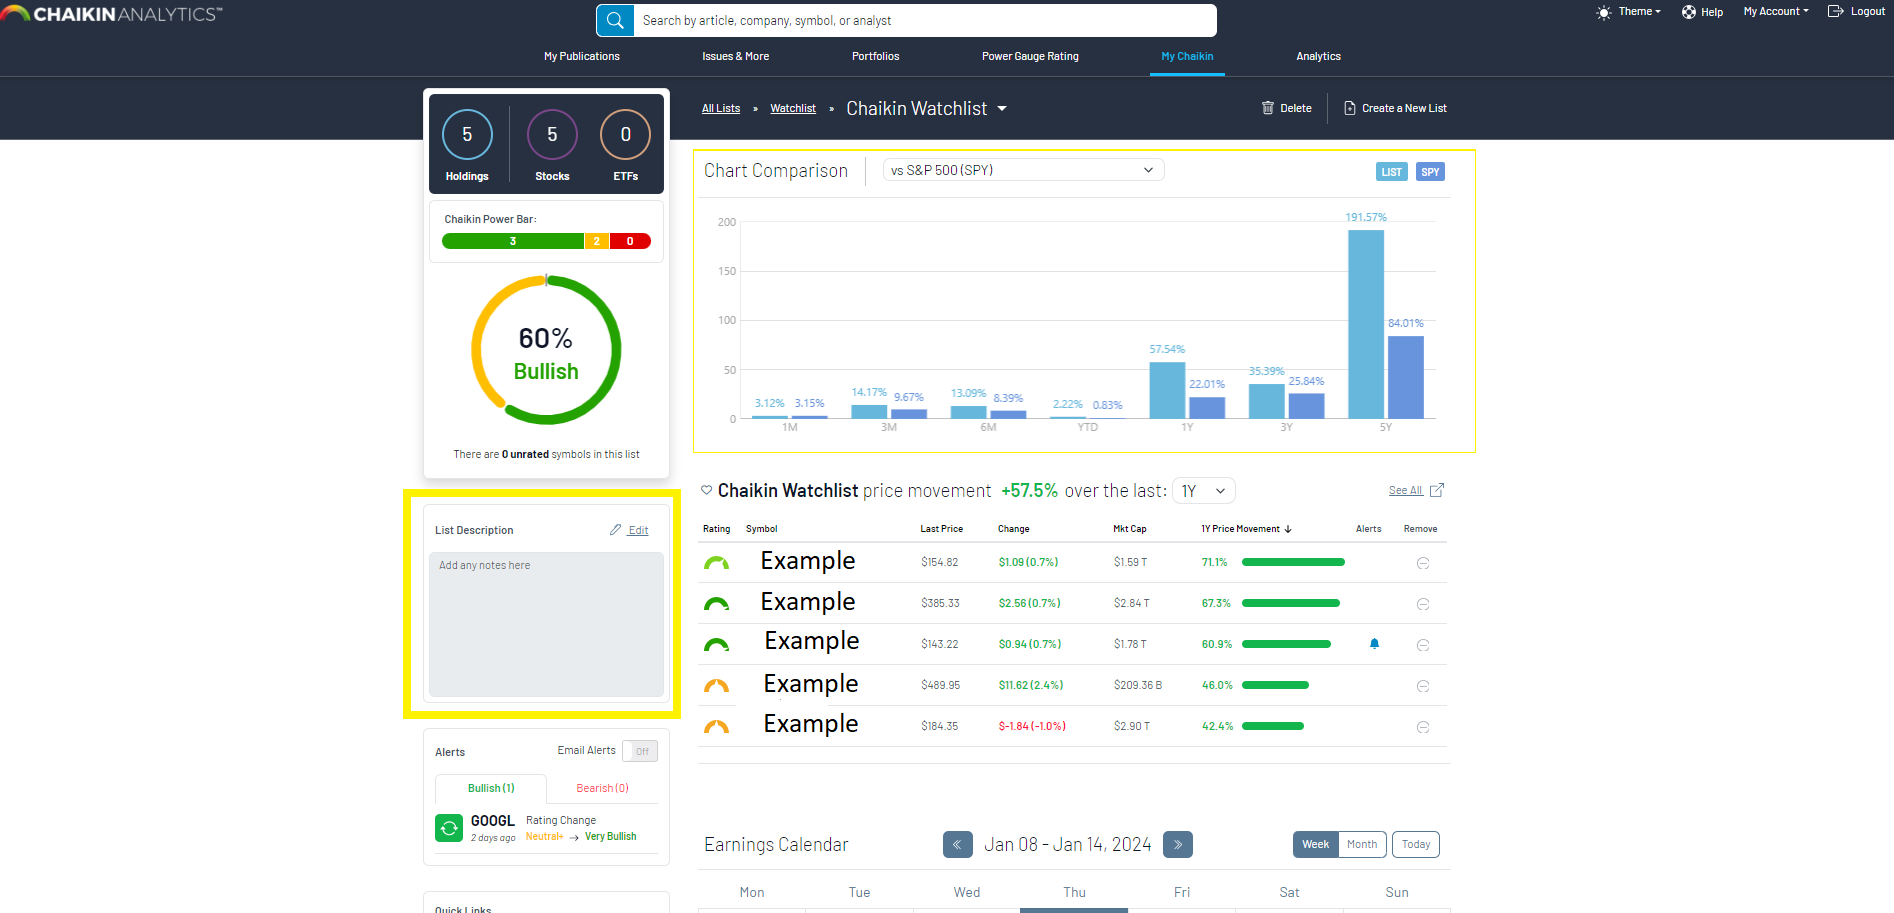
List Description
You can add a list description to any watchlist, including a note about the list. We suggest however that you do not input sensitive personal information, such as account numbers etc.
For Chaikin lists (that are not custom) you will see a description of the list in this spot.
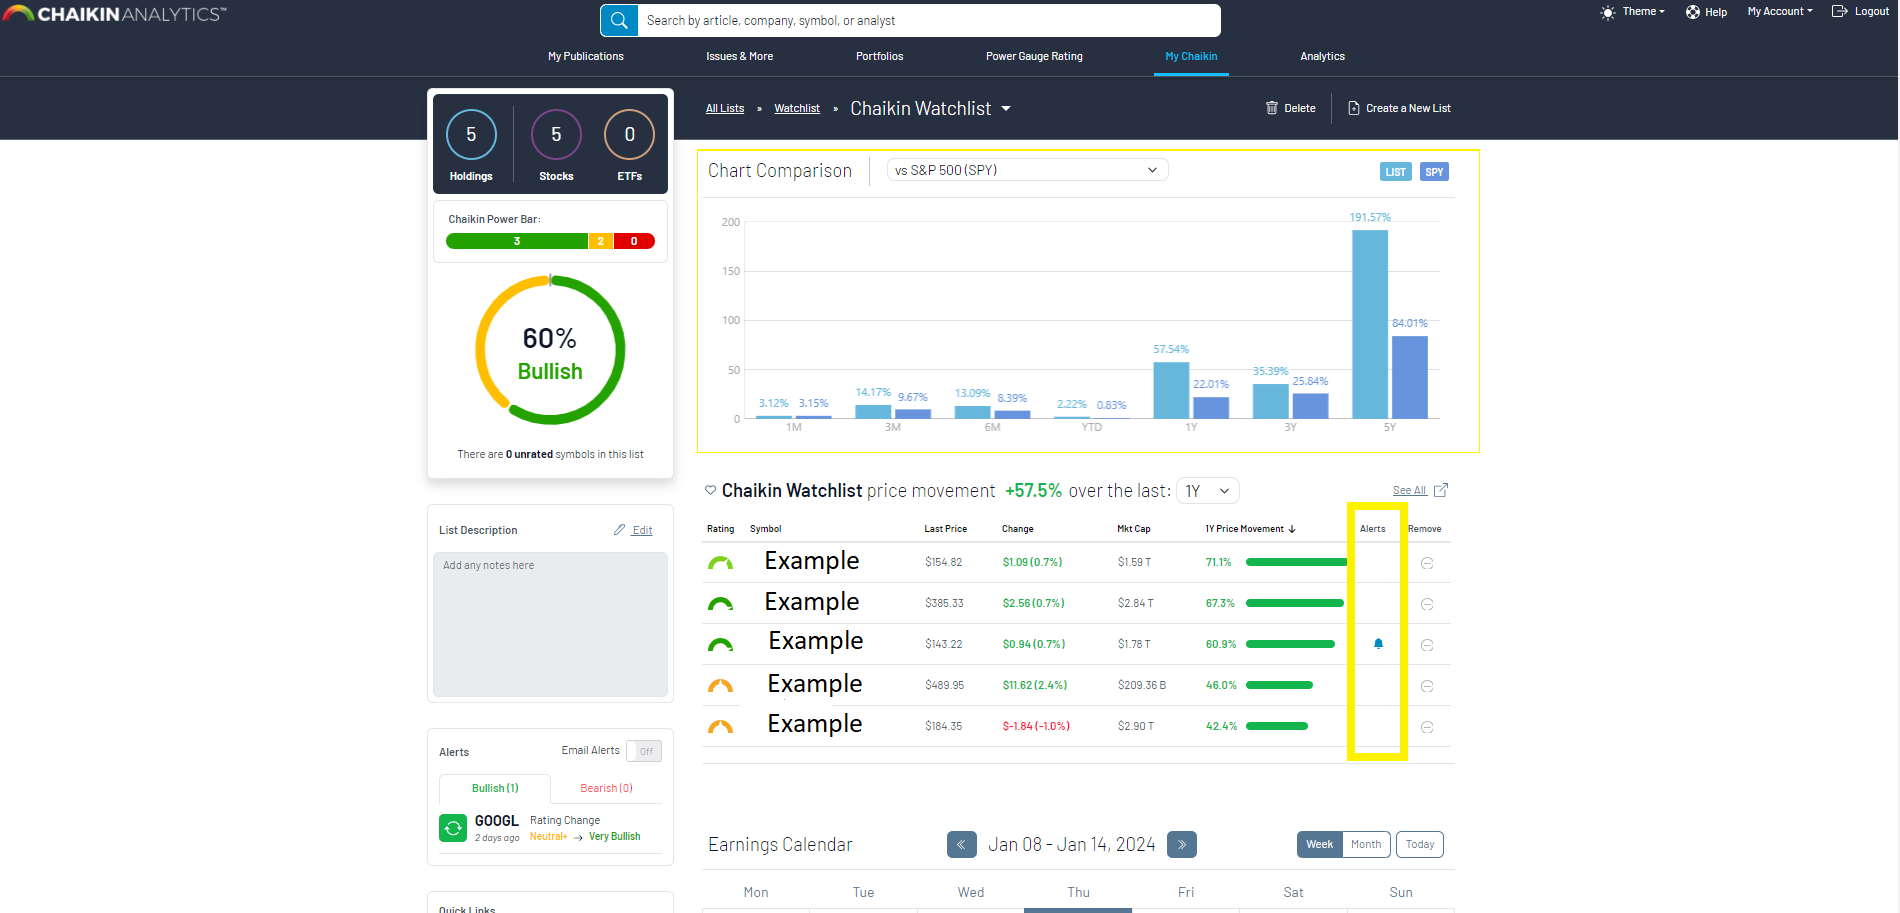
View Basic Alerts
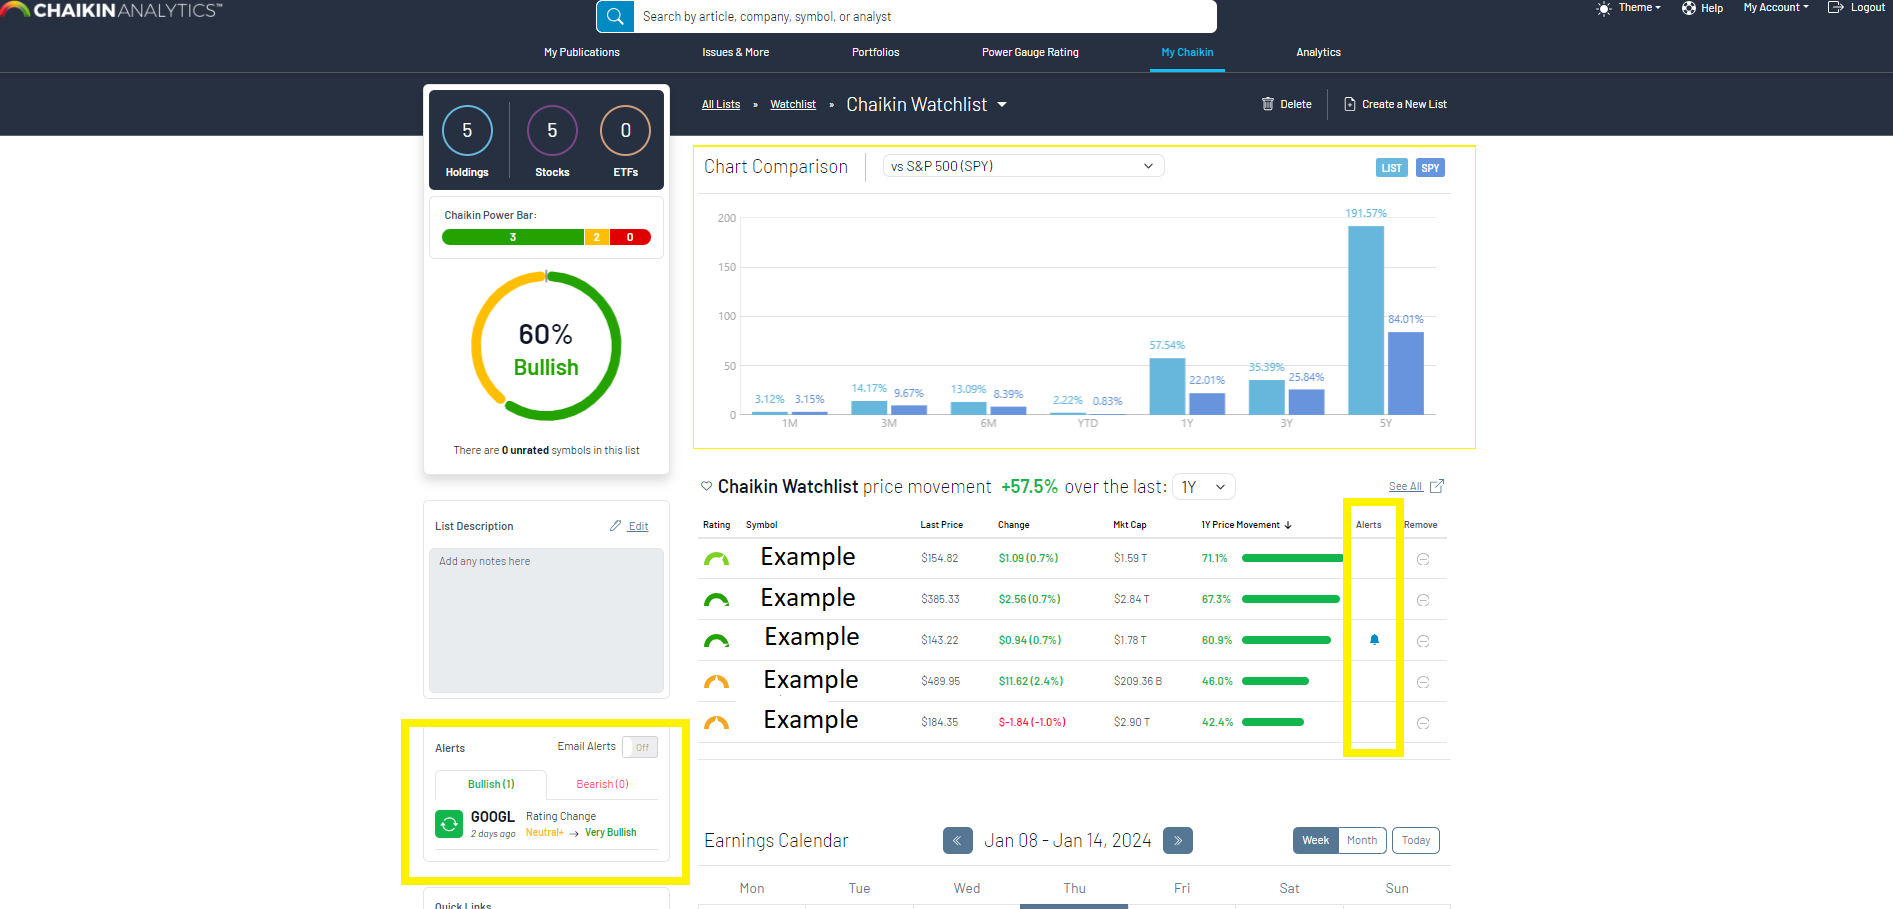
If any symbol in the list has an alert, you will be able to see an alert icon next to it in the Price Movement table, as well as see the alert information in the Alerts panel to the left of the table.
Click here to learn how to get email alerts.
If you are viewing a the Health Check for a list, you can also turn on email alerts from the Alerts panel as shown below. Alerts will be sorted into Bullish (Positive Changes) and Bearish (Negative Changes) in this menu. If you see a bell icon referenced in your list, you can see the specifics of that alert here.
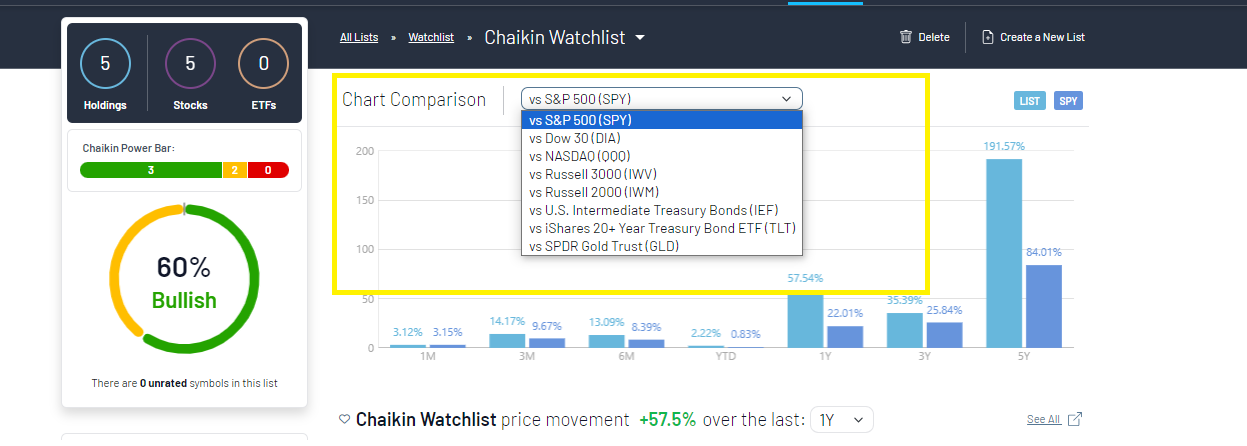
Compare to Benchmark
While viewing a list, you can compare its basic price movement to an ETF benchmark such as the S&P 500 (SPY) that appears on default.
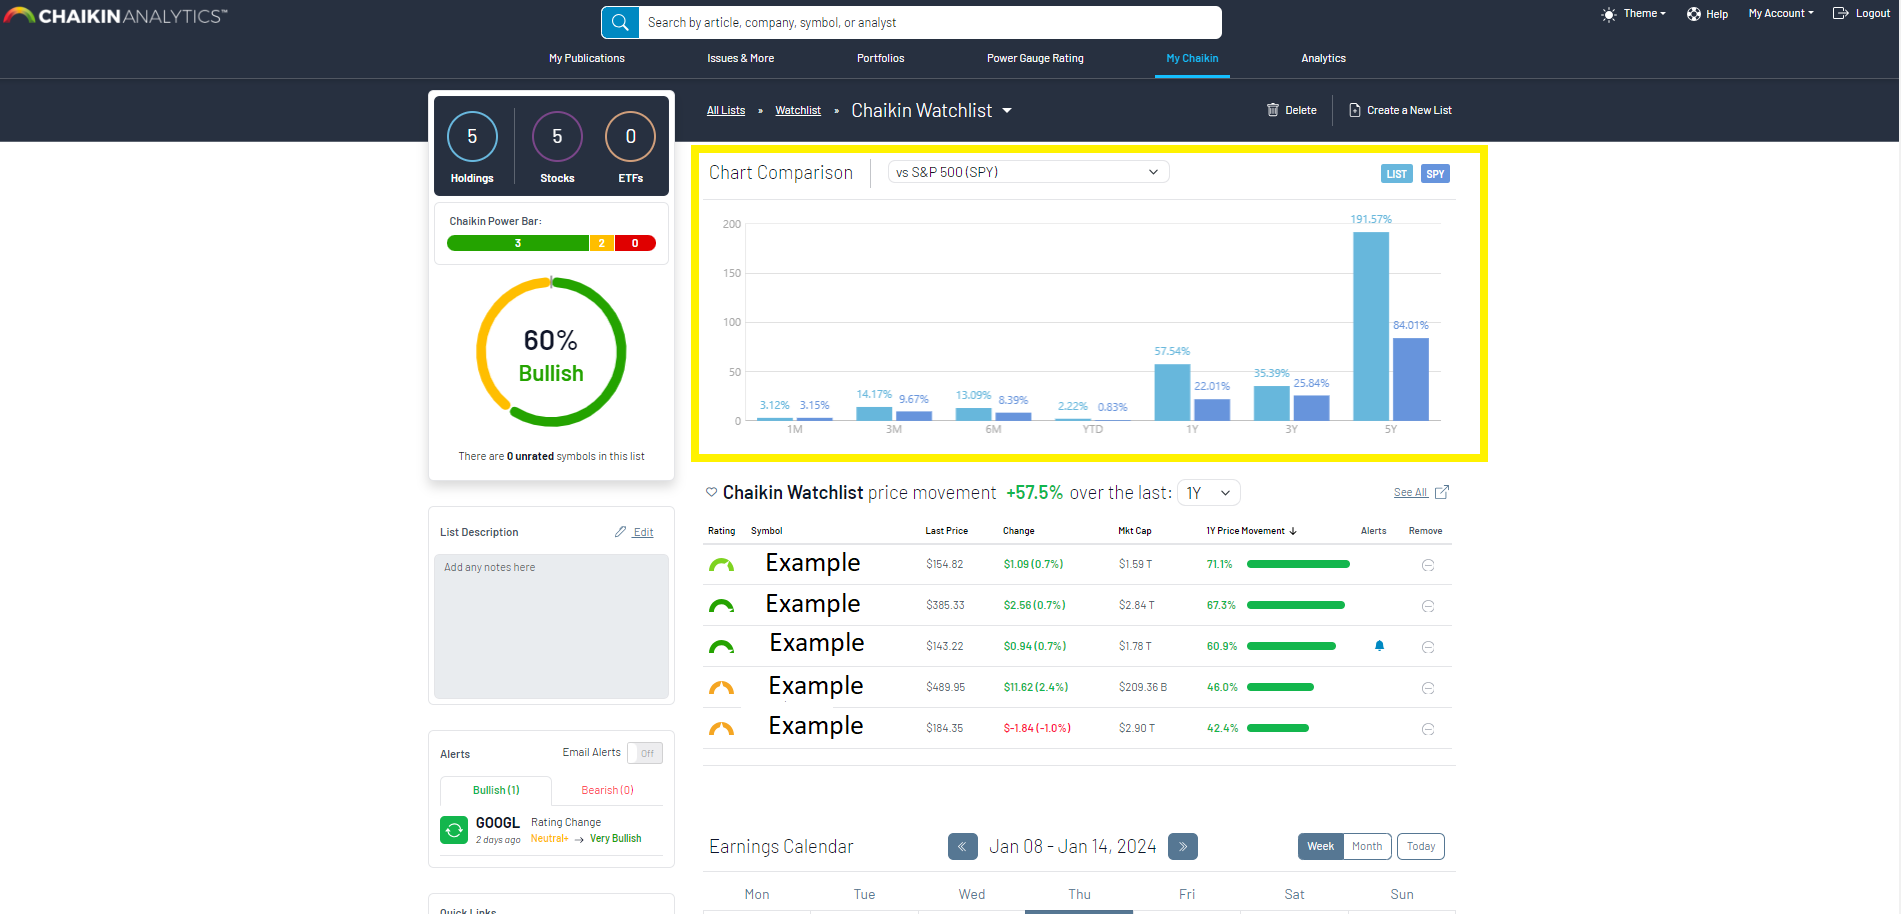
You can use the dropdown provided to change to any other benchmark on the list.
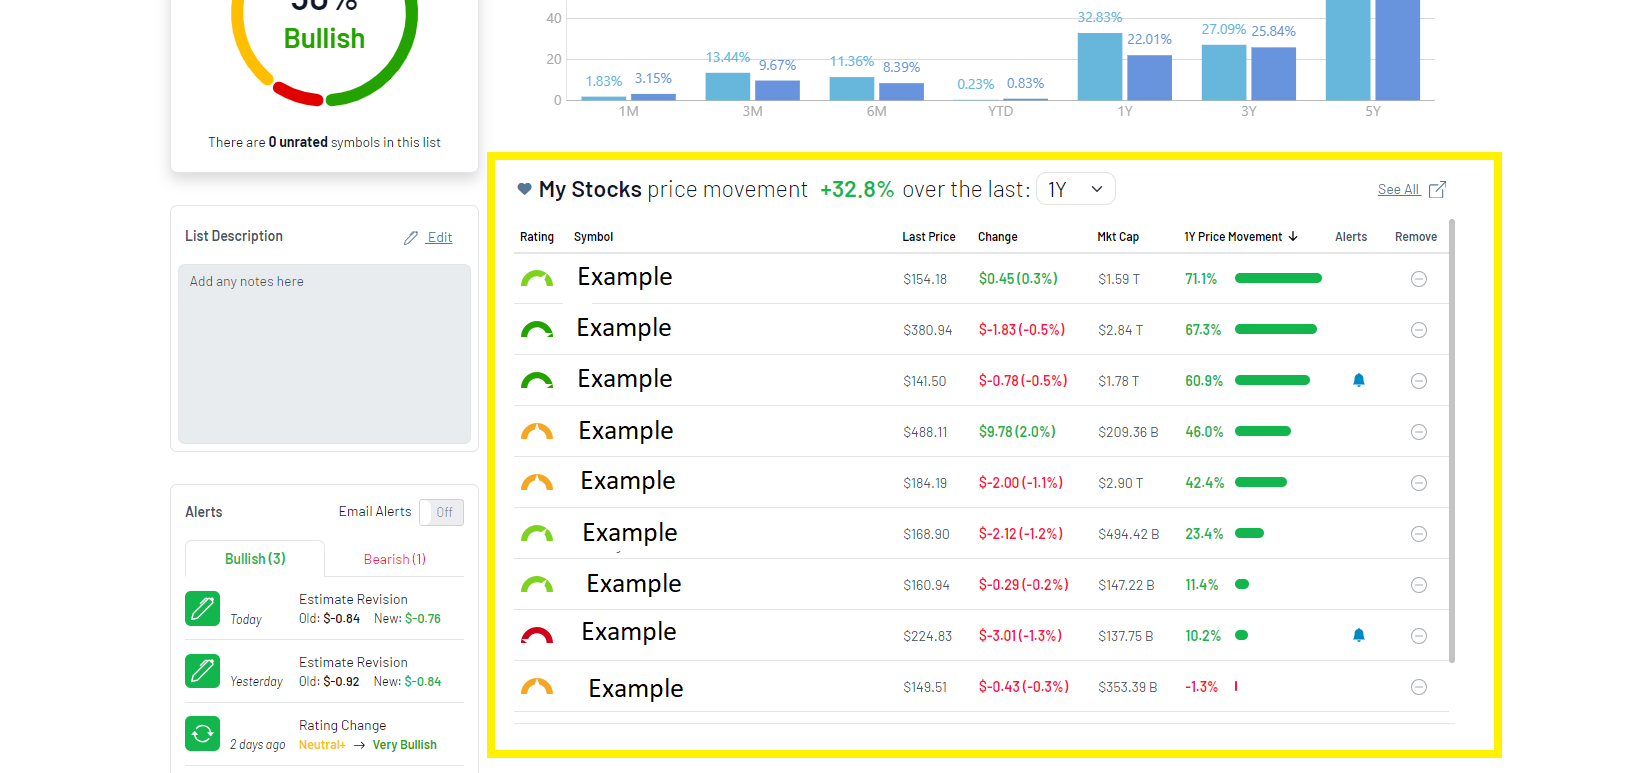
View Performance (price movement over 1 day, 1 month, 3 months, 1 year, or 5 years)
To get a sense of how each symbol within the list is doing, you can see a price movement table according to the time frame you choose. This defaults to 1 year.
The longer green bars are a quick visual indication of the symbols that are doing very well during that time frame. The long red bars show symbols that are doing very poorly in the selected time frame.
For longer lists, you can sort by any informational column, with the default sort being highest performance (price movement).
Earnings Calendar
Here you can see which stock within the list has upcoming earnings that week. For a wider range, you can switch to a month view.
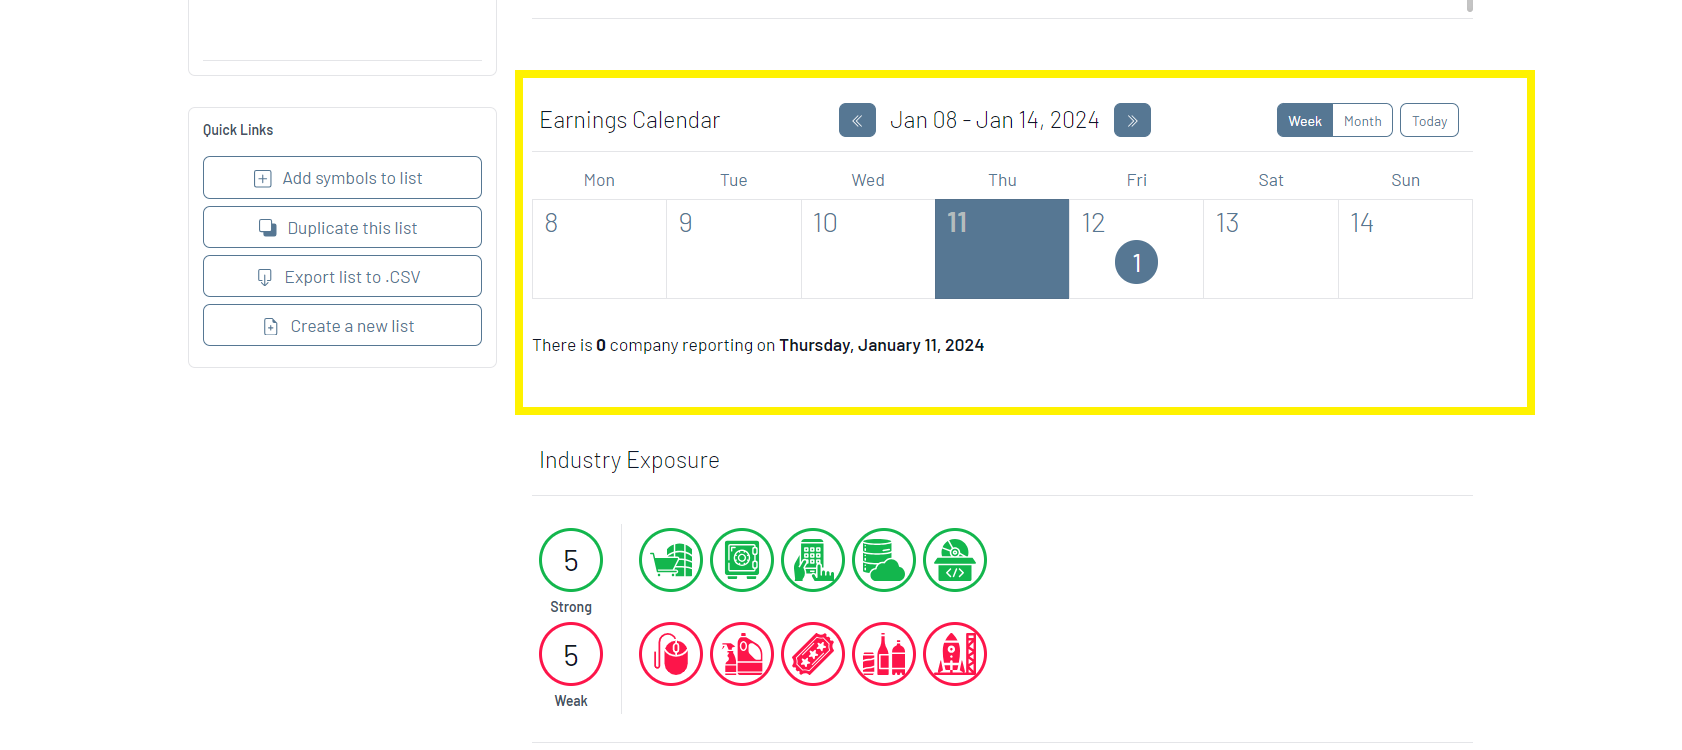
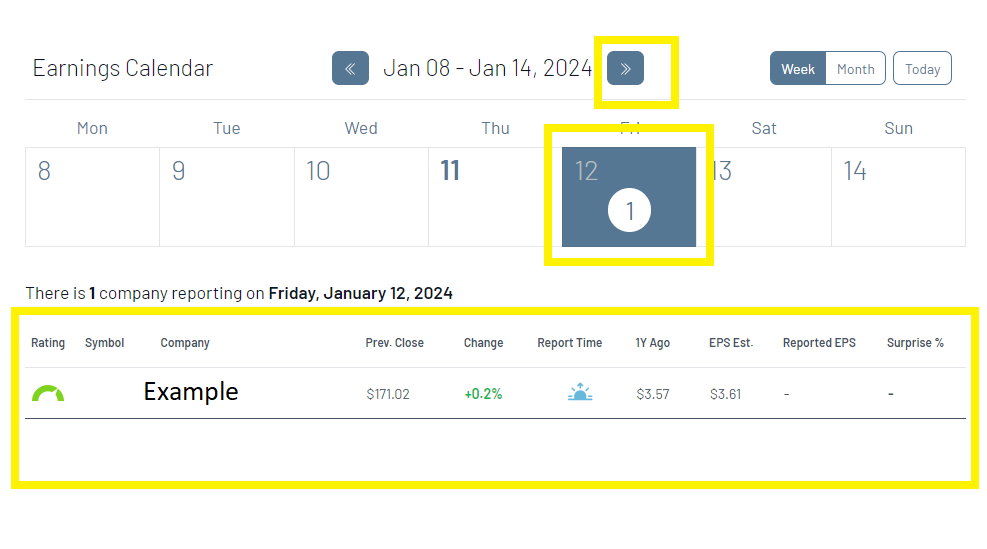
- To see past or upcoming earnings, click the arrows to the left or right of the date range respectively.
- The number of symbols reporting will appear in the calendar block.
- By clicking the block, the table below the calendar will populate with relevant earnings information.
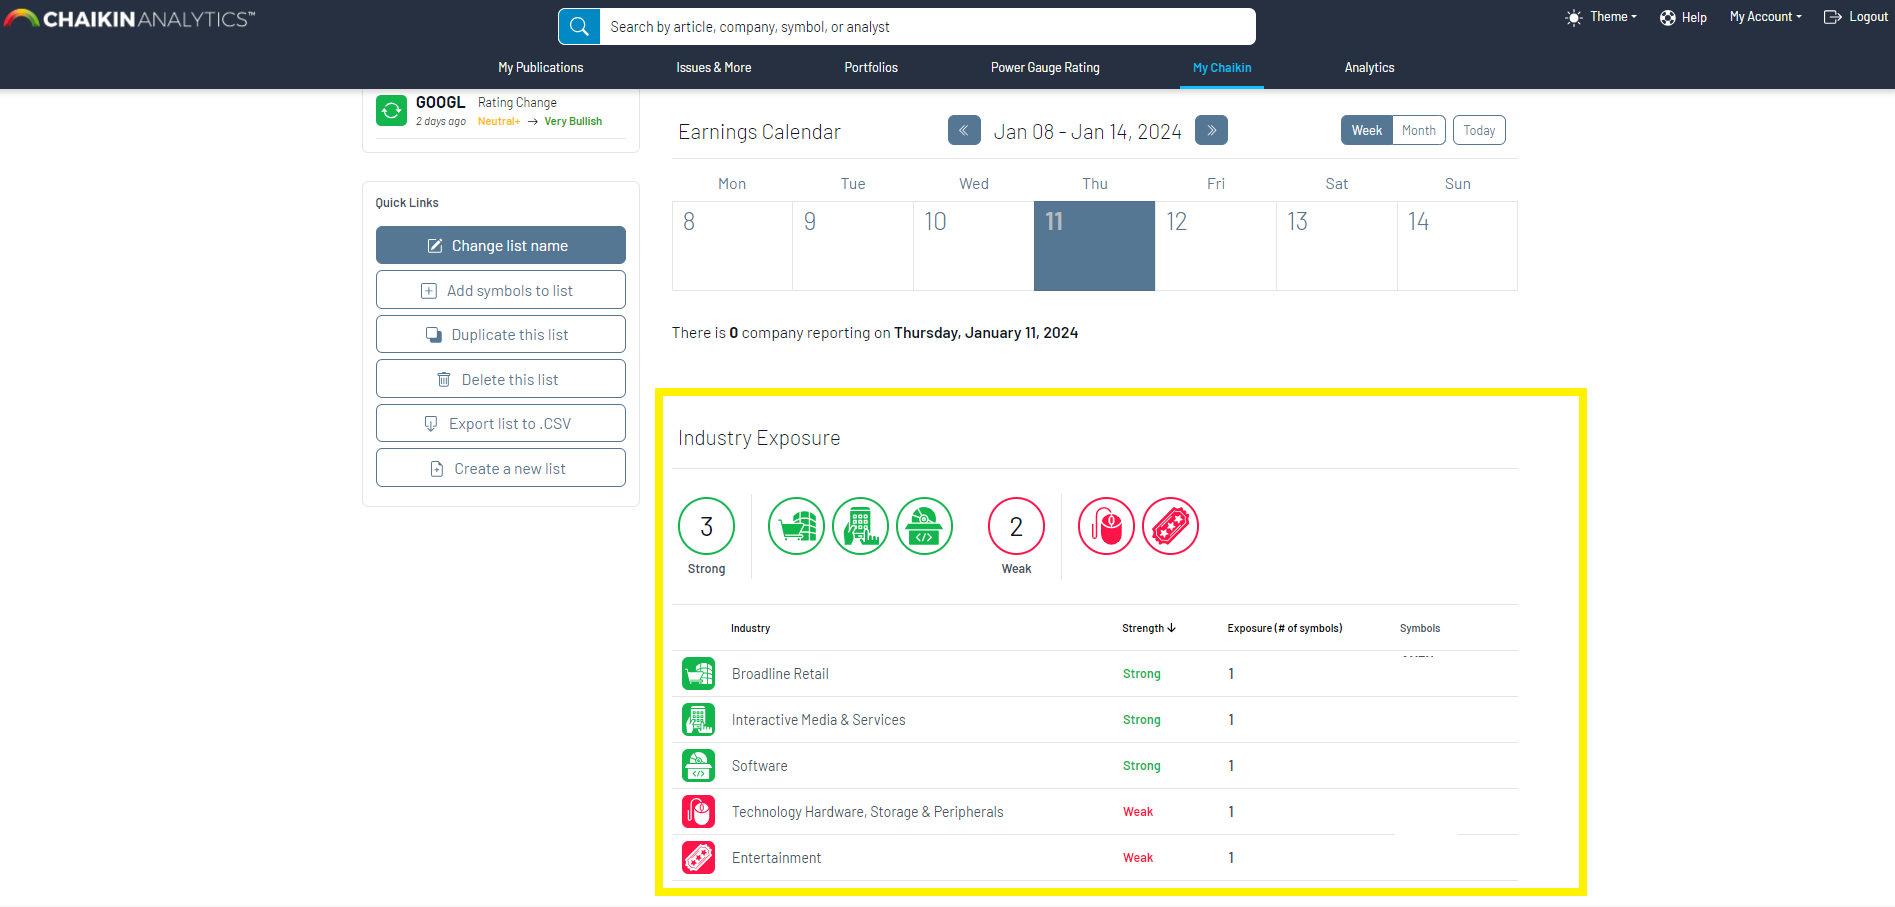
Industry Exposure
In this section, you'll be able to see how diverse the portfolio's industry exposure is, and how if Chaikin Power Gauge Rating considers the represented industries as strong vs weak industries: