Searching or clicking on an ETF symbol will bring you to the corresponding ETF page, where you can see the Power Gauge Rating for the ETF and other important information.
The Chaikin Power Gauge ETF Rating
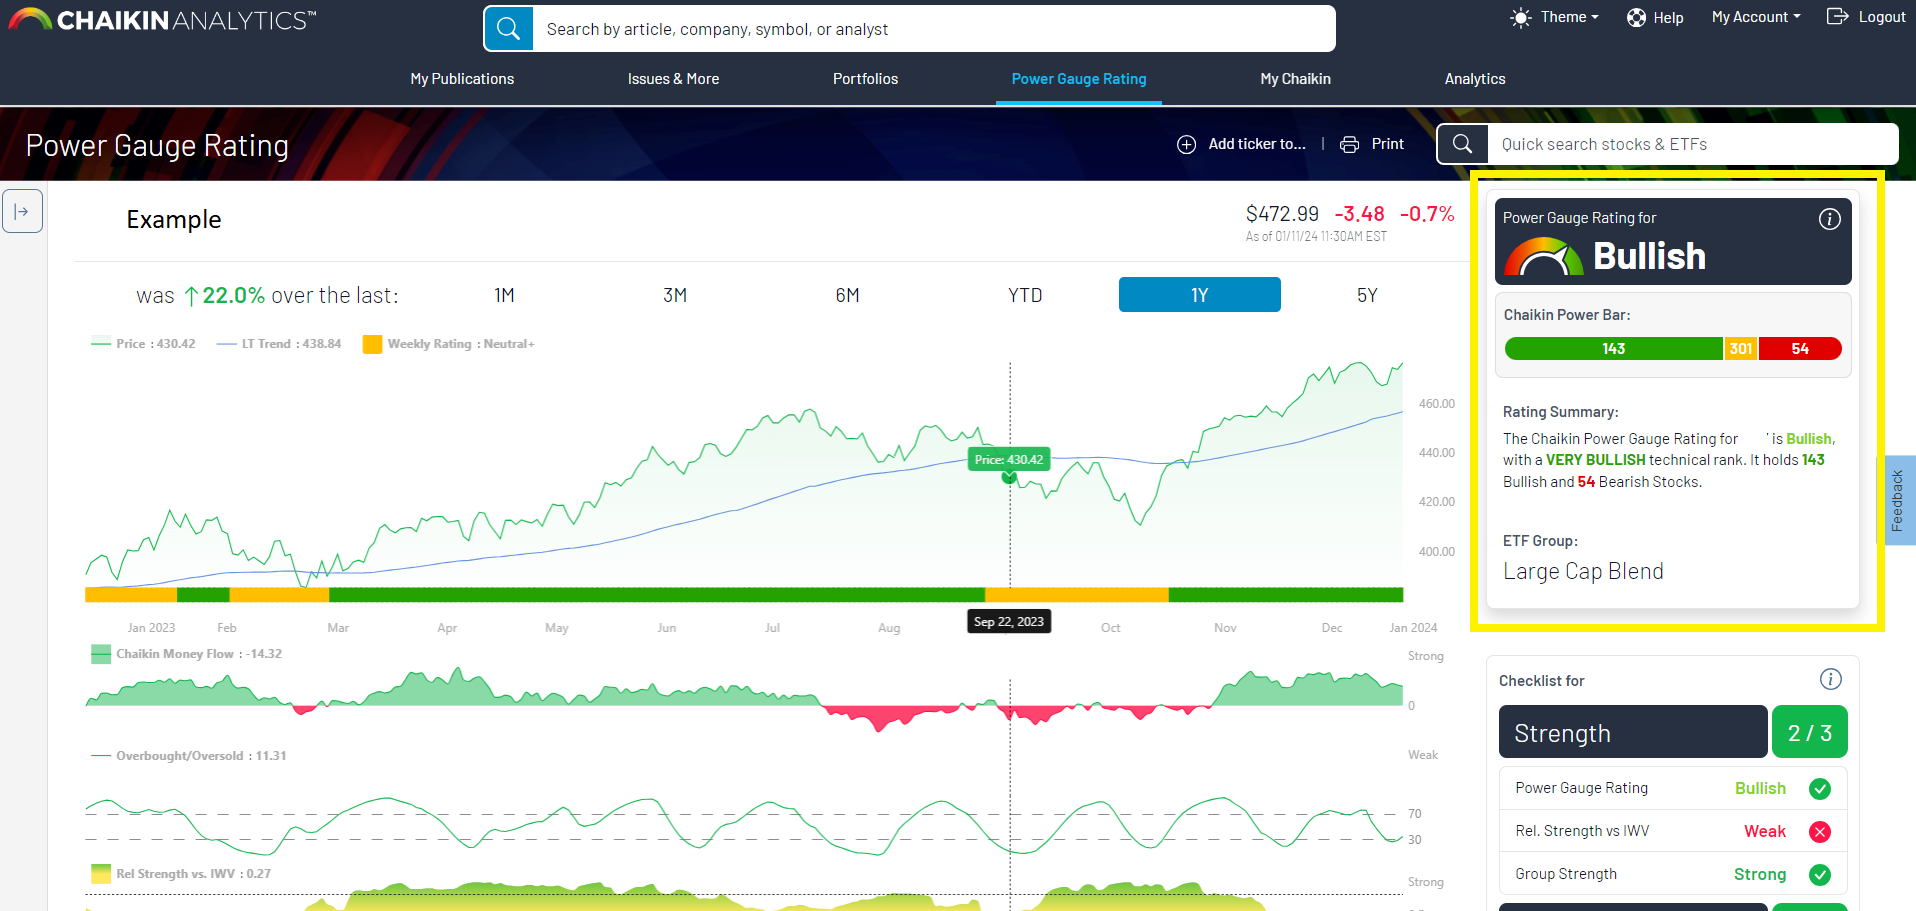
The first thing on the page is a quick overview of the Chaikin Power Gauge Rating. This includes the overall rating, as well as the Power Bar. The Power Bar shows the number of stocks held in the ETF that are Bullish/Very Bullish, Neutral, and Bearish/Very Bearish. Since the Neutral bar is kept at a constant width, it allows you to visualize the ratio of Bullish to Bearish stocks relative to each other. That is, if the green portion of the bar is longer than the red, it has mostly bullish stocks. If the opposite is true, it has mostly bearish stocks.
If the ETF does not hold US Equities, the ETF may not have a Power Bar displayed. In addition, not all types of ETFs are rated, so some ETFs may show no rating.
Click here for in-depth information about the Chaikin Power Gauge ETF Rating.
The Chart and Chaikin Indicators
In addition to the Power Gauge Rating is a simple chart showing close prices and Long Term Trend with 4 key indicators. The default selection is 1 year.
Price Chart: The price chart displays the stock's closed price for the corresponding trading day. Weekends and holidays when the market is closed are not included in the chart.
The chart displays in green if the price change over the time selected is positive and red if it is negative. Hover over the chart on desktop, or drag your finger on mobile to see specific closing price values and dates.
The blue line that cuts across the chart is the Long Term Trend (LT Trend). It’s Moving Average calculation of the past 200 days that includes Marc’s proprietary math that is meant to give a sense of the long-term price direction.
Indicator 1: Weekly Rating History Bar: Below the chart is a weekly historical rating summary, which shows the rating trend of the stock at the close of each corresponding week. This helps to visualize the trend of the rating over time.
Indicator 2: Chaikin Money Flow: Chaikin Money Flow is a proprietary measure of net accumulation (green) or distribution (red). This is a simple, effective way of including volume in your analysis, and has become an industry standard tool.
Indicator 3: Overbought/Oversold: This indicator provides a smoothed, scaled cyclical indication of where a stock is in its normal trading range
Indicator 4: Relative Strength vs SPY: This indicator provides a consistently scaled indication of a stock’s recent performance relative to the S&P 500. When the gradient gets to green, this indicates the stock has been strongly outperforming the market.
See more information on the Chaikin Indicators here.
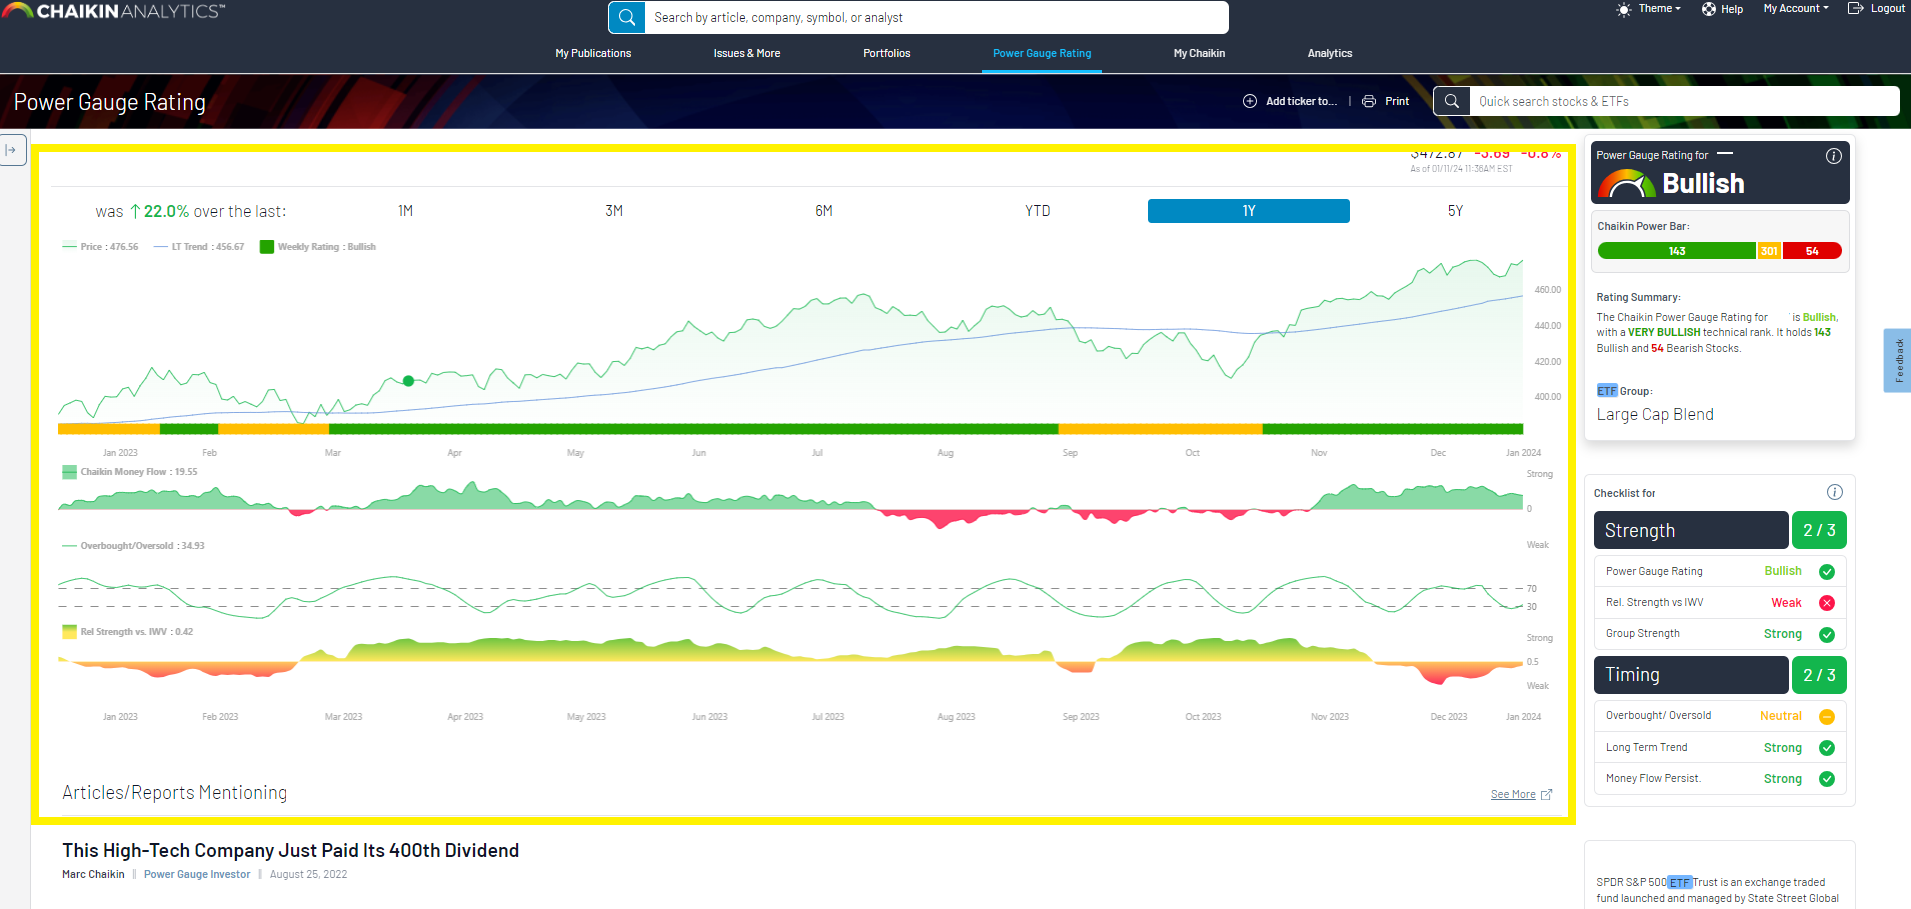
The ETF Checklist
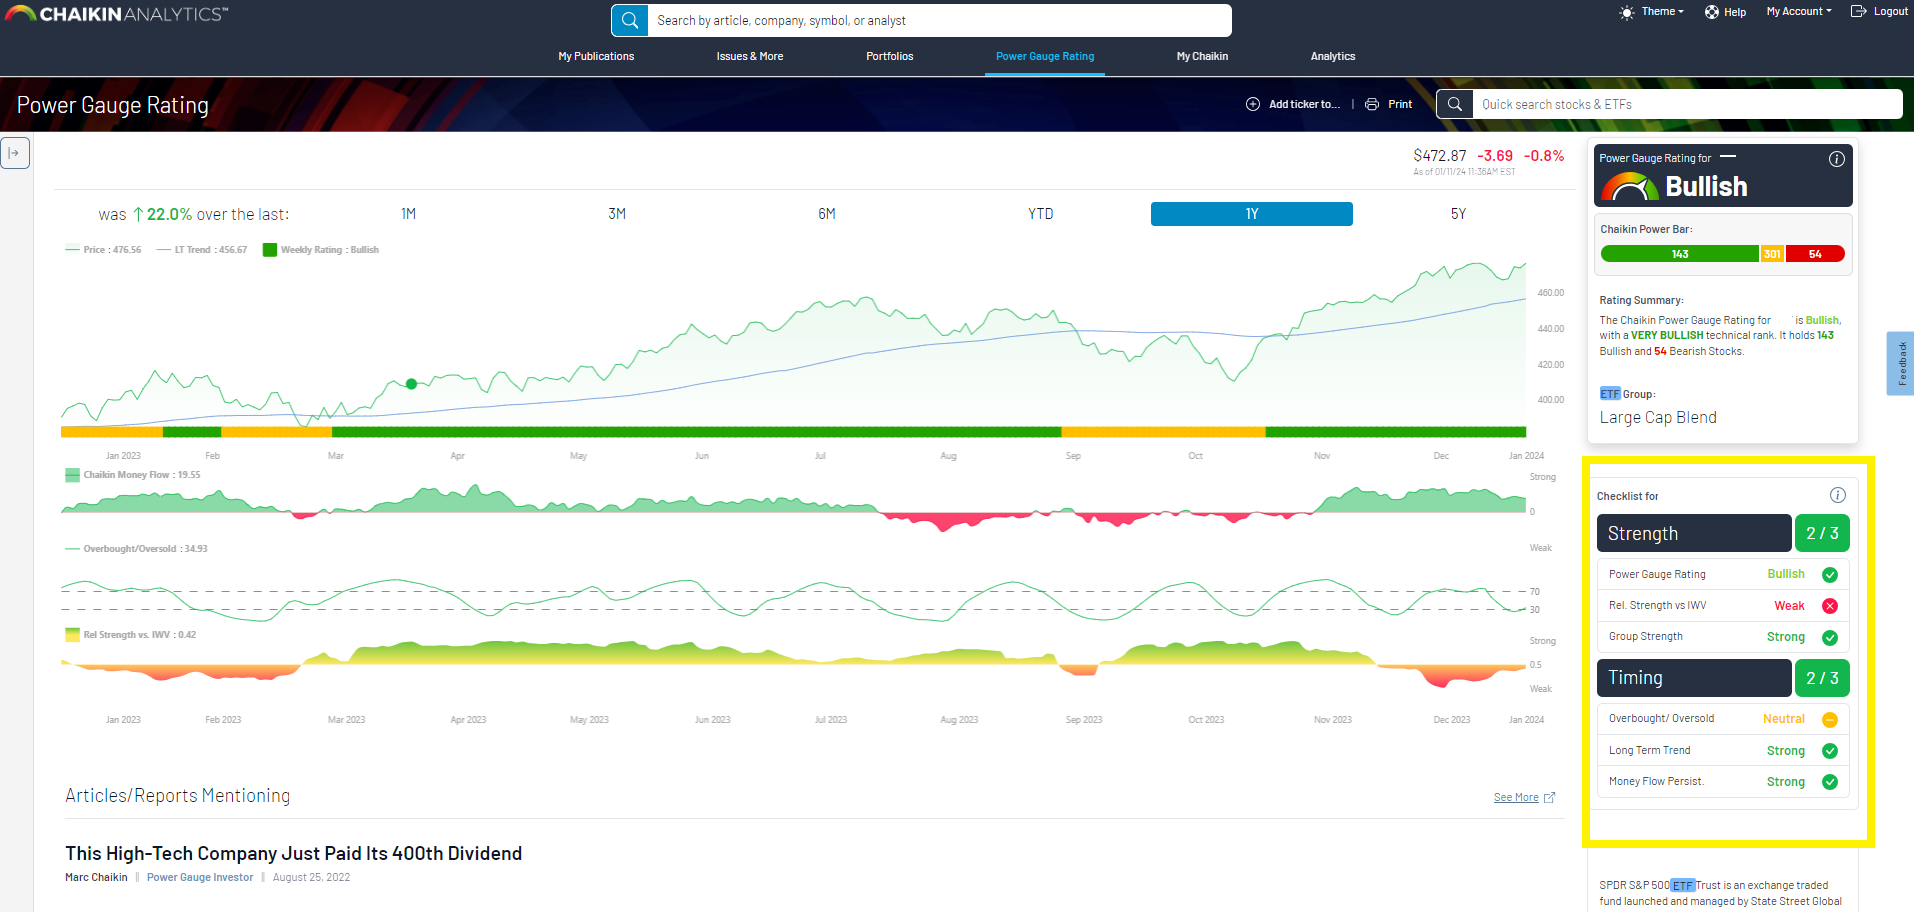
While there is no substitute for reading patterns and trends on the chart yourself, the ETF Checklist is designed to be your guide to the Chaikin Analytics chart and indicators, which are designed to be used in conjunction with each other. They are:
Strength
- The Power Gauge Rating (What does our model say about the stock?)
- Rel. Strength vs SPY (What does the market say?)
- ETG Group Strength (Will this ETF get tailwinds due to an overall lift in the group or the opposite?)
Timing
- Overbought/Oversold (Is it time to enter from a short term perspective?)
- Long Term Trend (Is this stock in a sustained technical uptrend?)
- Chaikin Money Flow Persistency (What does “Smart Money” say?)
If all of the checklist indicators are green, the weight of the evidence points to the likelihood this stock will outperform in the coming months. The fewer indicators that are green, the less likely for a positive outcome.
Click here for more information about the Chaikin ETF Checklist.
ETF Info and Quick Stats
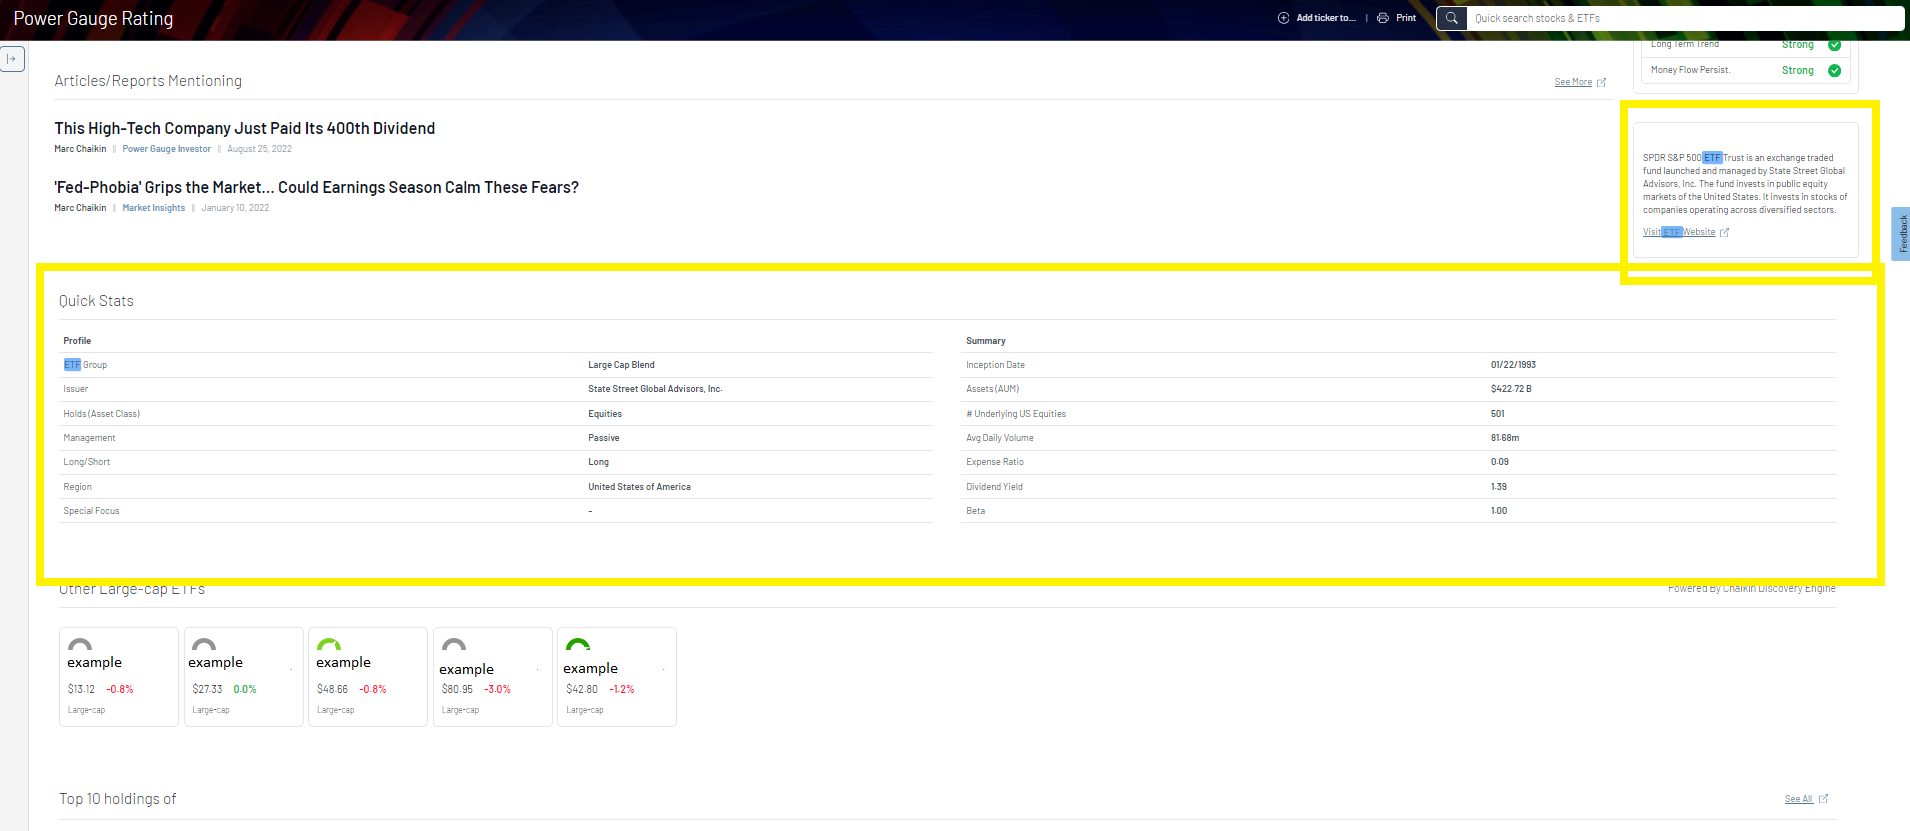
To find basic information about the ETF, or to link to the official ETF page, you can look to the ETF Info and Quick Stats.
ETF Holdings
When ETF holdings are available, we display the top 10, with a default sort by rating. To see the full list, you can click the “See all” option to the top right of the panel. ETF holdings give a sense of the type of companies that make up the ETF. These are the companies you are buying into when you invest in the ETF.
Other Ideas or Lists
If you like something about the selected ETF but want to find similar ones that match specific criteria, you can take a look at the following three areas of the page:
- Other ETFs - Powered by our Discovery Engine, this shows the top 5 ETFs that are most closely related to the selected one.
- Hotlists Containing - If the ETF appears in a Chaikin hotlist, you will see it listed here so you can see other symbols that are the same list.