The Chaikin Analytics Screener is designed to allow flexible combinations of various criteria, focusing on Chaikin’s most high-value analytical tools: the Chaikin Power Gauge Rating, its Components and Factors, Industry Rating, Stock Performance, and selected Technical Indicators, Signals, and Fundamental fields.
Fundamentals are primarily represented in Power Gauge Factors – we are not attempting to provide an open-ended Fundamental data screener.
Stock Universe
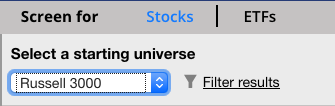
The default will be the Russell 3000 stocks. Other choices are as follows:
| All Rated Stocks | All active stocks in the Chaikin Analytics system with a valid Power Gauge Rating |
| Russell 3000 |
All stocks in the iShares Russell 3000 ETF (IWV). These include large, mid, and small cap stocks covering about 98% of the total market value of U.S. listed companies.
(Note: for various reasons there may not be exactly 3000 stocks in the Russell 3000 list). |
| SP500 |
All stocks in the SPDR SP500 ETF (SPY). These are the 500 largest cap stocks listed on U.S. exchanges as determined by Standard & Poors.
(Note: for various reasons there may not be exactly 500 stocks in the SP500 list). |
| Growth Stocks | All stocks in the iShares Russell 3000 Growth ETF (IUSG). |
| Value Stocks | All stocks in the iShares Russell 3000 Value ETF (IUSV). |
| Large Cap Growth | All stocks in the iShares Russell 1000 Growth ETF (IWF). |
| Large Cap Value | All stocks in the iShares Russell 1000 Value ETF (IWD). |
| Small Cap Growth | All stocks in the iShares Russell 2000 Growth ETF (IWO). |
| Small Cap Value | All stocks in the iShares Russell 2000 Value ETF (IWN). |
| Strongest Industries |
Stocks in the top 20% of S&P's Groups, as determined by Chaikin Power Bar Score. Industries without a positive Bullish/Bearish balance are excluded, even if in the top 20%. (This generally reflects the top 12 items in the Industries section of the List Navigator, when sorted by Rating). |
| Weakest Industries |
Stocks in the bottom 20% of S&P’s Industry Groups, as determined by Chaikin Power Bar Score. Industries without a negative Bullish/Bearish balance are excluded, even if in the bottom 20%.
(This generally reflects the bottom 12 items in the Industries section of the List Navigator, when sorted by Rating). |
| Select an Industry… | Select a specific Industry Group as your starting Universe. |
| Select a Sector… | Select one or more of the 11 SPDR Sector ETFs as your starting universe. |
| Select a Subsector…. | Select one or more of the 22 SPDR Subsector ETF’s as your starting universe. |
| Select a User List…. | Select a User List as your Stock Universe. Note that a User List will not be available for screening until 24 hours after it was loaded. |
Global Filter
The Global Filter allows you to exclude certain stocks from your work in Chaikin Analytics based on minimum price, liquidity, market capitalization criteria and optionable status.

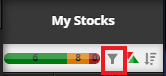
The Filter icon indicates the state of the Global Filter (blue = On, grey = Off).
Click the Filter icon to edit Global Filter Settings and turn it on or off.
By default, the Global Filter is On, and will exclude stocks where any of the following is true:
- Previous Close < $3
- 20-day Avg Volume < 25,000 shares
- Market Cap < $50 million
- Stock is not optionable
You can change these settings and click Save to apply them.
The same settings apply in the Watchlist and the Screener. Any changes you make in either place will apply in both.
If the Global Filter is On when you run a Screen, its criteria will be applied to the Starting Universe before Screening Criteria are applied. That is, only results that also pass your Global Filter settings will appear.
Rating Criteria
In the Rating section, you can set Screening Criteria for a stock’s Power Gauge Rating, and up to 3 Power Gauge Components or Factors.
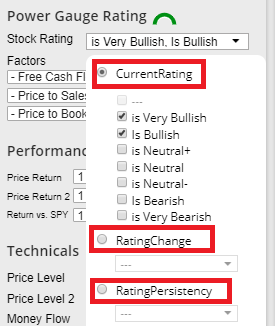
Power Gauge Criteria
The Power Gauge Rating menu allows you to screen for stocks whose Power Gauge Ratings meet certain criteria.
All Power Gauge Rating criteria look at the “corrected” Power Gauge Rating, with the Technical Overlay applied.
Here the choices for the Power Gauge Rating that may be used in the Screener. You may select to Screen on current rating, Rating Change, or Rating Persistency.
Power Gauge Components and Factors
Power Gauge model.
You can select up to 3 Components or Factors to include in your Screening Criteria, and specify a value for each.
If the value is empty, the Factor will not be included in the screen.
The menus default to 3 of the most heavily-weighted factors in the model.
| Component or Factor | Includes Stock if… |
| — | (empty) |
| is Very Strong | Component or Factor is in the top quintile today |
| is Strong | Component or Factor is in the 2nd quintile today |
| is Neutral | Component or Factor is in the 3rd quintile today |
| is Weak | Component or Factor is in the 4th quintile today |
| is Very Weak | Component or Factor is in the bottom quintile today |
| turned Strong today | Component/Factor was not Strong yesterday but is Strong today |
| turned Strong this week | Component/Factor was not Strong at end of previous calendar week but is Strong today |
| turned Weak today | Component/Factor was not Weak yesterday but is Weak today |
| turned Weak this week | Component/Factor was not Weak at end of previous calendar week but is Weak today |
| big gain this week | Component/Factor had a significant gain from end of previous calendar week to today |
| big loss this week | Component/Factor had a significant loss from end of previous calendar week to today |
Note: It is technically possible to make multiple statements about a Factor which may be contradictory. This is not prevented, but will lead to 0 Results.
Performance Criteria
In the Performance section, you can set criteria based on a stock’s price return over time, on an absolute basis and relative to the SPY (SP500 ETF, which closely tracks the SP500 index).
For the Price Return criteria, select a time frame and a minimum percent return Up or Down over the period – or find stocks at-or-near their high or low for the period.
You can make two statements about Price Return. This can be useful, for instance, to find stocks which are up 20% Year-to-Date, but down 5% within the last month (“High Flyers with Pullbacks”).
For Return vs SPY, select a time frame and an amount by which the stock must have either outperformed or underperformed the SPY over the period.
| Up… | Description |
| At/near high |
Most recent closing price is greater than or equal to the highest closing price for the previous (1 week, 1 month, 3 months, 6 months, 1 year, current year-to-date).
All except “1 week” have a 2% tolerance. |
| At/near low |
Most recent closing price is less than or equal to the lowest closing price for the previous (1 week, 1 month, 3 months, 6 months, 1 year, current year-to-date).
All except “1 week” have a 2% tolerance. |
| Up… | Most recent closing price is at least (2%, 5%, 10%, 20%, 50%) greater than closing price (1 week ago, 1 month ago, 3 months ago, 6 months ago, 1 year ago, at end of prior calendar year). |
| Down… | Most recent closing price is at most (2%, 5%, 10%, 20%, 50%) less than closing price (1 week ago, 1 month ago, 3 months ago, 6 months ago, 1 year ago, at end of prior calendar year). |
Note: It is technically possible to make multiple statements about Price Return which are contradictory. This is not prevented, but will lead to 0 Results.
| Return vs. SPY | Description |
| Up… | Percent change of stock’s closing price is at least (2%, 5%, 10%, 20%, 50%) greater than percent change of SPY’s closing price over (1 week, 1 month, 3 months, 6 months, 1 year, current year-to-date) |
| Down… | Percent change of stock’s closing price is at most (2%, 5%, 10%, 20%, 50%) less than percent change of SPY’s closing price over (1 week, 1 month, 3 months, 6 months, 1 year, current year-to-date) |
Technical Criteria
In the Technicals section, set criteria for current Price levels, various indicators included on Chaikin Analytics charts, and Relative Volume.
Price Level
You can select up to 2 criteria for Price Level.
| Menu | Selection | Description |
| Price Level | Overbought | Closing price is high in its short-term range. OB/OS is greater than or equal to 70. |
| Oversold | Closing price is low in its short-term range. OB/OS is less than or equal to 30. | |
| Above Rising LT trend | Closing price is above its long-term trend (DEMA); trend rising over last 3 months, and last 5 days. | |
| Below Falling LT trend | Closing price is below its long-term trend (DEMA); trend is falling over last 3 months, and last 5 days. | |
| Near Upper Band | Closing price is within 2% of its Upper Chaikin Band (above or below). | |
| Above Upper Band | Closing price is greater than or equal to its Upper Chaikin Band. | |
| Near Lower Band | Closing price is within 2% of its Lower Chaikin Band (above or below). | |
| Below Lower Band | Closing price is less than or equal to its Lower Chaikin Band. | |
| Above EMA 21 | Closing price is greater than its 21-day Exponential Moving Average (EMA21). | |
| Below EMA 21 | Closing price is less than its 21-day Exponential Moving Average (EMA21). | |
| Above DEMA | Closing price is greater than its 200-day Double Exponential Moving Average (DEMA). Also: Chaikin Trend, long-term trend. | |
| Below DEMA | Closing price is less than its 200-day Exponential Moving Average (DEMA). Also: Chaikin Trend, long-term trend. | |
| Crossover EMA21 today | Closing price was less than or equal to EMA21 yesterday and Closing price is greater than EMA21 today. | |
| Crossunder EMA21 today | Closing price was greater than or equal to EMA21 yesterday and Closing price is less than EMA21 today. | |
| Crossover DEMA today | Closing price was less than or equal to DEMA yesterday and Closing price is greater than DEMA today. Also: Chaikin Trend, long-term trend. | |
| Crossunder DEMA today | Closing price was greater than or equal to DEMA yesterday and Closing price is less than DEMA today. Also: Chaikin Trend, long-term trend. |
Money Flow
| Menu | Selection | Description |
| Money Flow | Very Strong | Chaikin Money Flow is greater than or equal to 25 |
| Strong | Chaikin Money Flow is greater than or equal to 5 | |
| Weak | Chaikin Money Flow is less than or equal to -5 | |
| Very Weak | Chaikin Money Flow is less than or equal to -25 | |
| 1 mo high persistency | Chaikin Money Flow was greater than 0 70% of the last 20 trading days | |
| 1 mo low persistency | Chaikin Money Flow was less than 0 70% of the last 20 trading days | |
| 3 mo high persistency | Chaikin Money Flow was greater than 0 70% of the last 60 trading days | |
| 3 mo low persistency | Chaikin Money Flow was less than 0 70% of the last 60 trading days | |
| 6 mo high persistency | Chaikin Money Flow was greater than 0 70% of the last 120 trading days | |
| 6 mo low persistency | Chaikin Money Flow was less than 0 70% of the last 120 trading days |
Relative Strength
| Menu | Selection | Description |
| Rel Strength | Very Strong | Chaikin Relative Strength is greater than or equal to .8 |
| Strong | Chaikin Relative Strength is greater than or equal to .6 | |
| Weak | Chaikin Relative Strength is less than or equal to .5 | |
| Very Weak | Chaikin Relative Strength is less than or equal to .2 | |
| 1 mo high persistency | Chaikin Relative Strength was greater than .5 70% of the last 20 trading days | |
| 1 mo low persistency | Chaikin Relative Strength was less than .5 70% of the last 20 trading days | |
| 3 mo high persistency | Chaikin Relative Strength was greater than .5 70% of the last 60 trading days | |
| 3 mo low persistency | Chaikin Relative Strength was less than .5 70% of the last 60 trading days | |
| 6 mo high persistency | Chaikin Relative Strength was greater than .5 70% of the last 120 trading days | |
| 6 mo low persistency | Chaikin Money Flow was less than 0 70% of the last 120 trading days |
Relative Volume
| Menu | Selection | Description |
| Relative Volume | Very Heavy | 9 day average volume is greater than or equal to 2 times 90 day average volume |
| Heavy | 9 day average volume is greater than or equal to 1.5 times 90 day average volume | |
| Light | 9 day average volume is less than or equal to .5 times 90 day average volume | |
| Very Light | 9 day average volume is less than or equal to .25 times 90 day average volume |
Note: In all cases above “Today” refers to the most recent Trading Day for which market data is available.
Min/Max Price
Select minimum and maximum values for closing price.
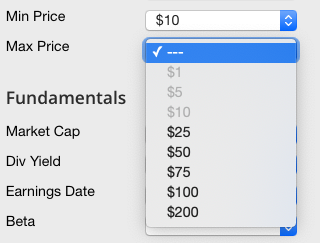
Fundamental Criteria
In the Fundamentals section, select criteria related to Market Cap, Dividend Yield, and Earnings Date.
Other Fundamental fields may be represented as Factors in the Rating Criteria section.
| Menu | Selection | Description |
| Market Cap | Micro Cap | Market Cap is less than $300 million |
| Small Cap | Market Cap is between $300 million and $2 billion | |
| Mid Cap ($2b – $10b) | Market Cap is between $2 billion and $10 billion | |
| Large Cap (> $10b) | Market Cap is at least $10 billion | |
| Small & Mid Cap | Market Cap is between $300 million and $10 billion | |
| Mid & Large Cap | Market Cap is at least $2 billion | |
| Div Yield | Positive | Dividend Yield > 0 |
| 1%-5% | Dividend Yield is at least (1%, 2%, 3%, 4%, 5%) | |
| Earnings Date | Today/Yesterday | Company reported Earnings either yesterday or today* |
| Tomorrow | Company reports Earnings tomorrow | |
| Within the next week | Company reports Earnings within the next 7 days | |
| Within the past week | Company has reported Earnings within the last 7 days. | |
| Beta | Low < 1 | Lower volatility than the market (S&P500) |
| =>1 and <=2 | Voltatily at the market or moderately higher | |
| High >2 | Much higher volatility than the market (S&P500) |
*Earnings report dates are updated nightly, and indexed for Screening before each market open. When a company reports during the day, its “Last Report Date” and “Next Report Date” will be updated to reflect this in the Screener the following day. All dates are current calendar day, Eastern U.S. time.
In Chaikin Analytics, the fundamental fields we have found to be predictive to future intermediate-term relative price performance are included in the Power Gauge model. Factors are normalized to either the stock’s Industry Group or the Russell 3000, based on our backtesting.
Signals
In the Signals section, screen for stocks which have had Chaikin Buy or Sell Signals within the last week.