Stock Screener

Overview

Screener Display

The Chaikin Analytics Screener is a powerful tool for finding stocks and ETF's which meet criteria you specify. The first step is to select whether you wish to screen stocks or ETF's.  Once you make tha selection, you can select a starting Universe, apply Global Filter criteria, and combine Power Gauge, Performance, Technical, and Fundamental criteria, as well as Chaikin Buy/Sell Signals. The Screener is designed to allow you to try ideas in rapid succession, to see the effect on results.

Matching results are displayed in the Results window and can be saved as a User List, and viewed immediately in the Workspace.


Data Availability

Data is indexed for Screening once a day prior to market open on trading days, and on Saturday evenings. The data used in screening is the most current data available as of the time of indexing, which is shown at the bottom of the Rules Window.

Only active stocks in the Chaikin Analytics system are included for screening. This may include stocks with no Power Gauge Rating. ETFs are not included in screens.

Rules Window

In the Rules Window, select a starting Stock Universe and specify Screening Criteria to generate a list of matching Results.

Default State

Initially, the Screener will be set to a starting Universe of Russell 3000 and a Power Gauge Rating of Very Bullish and Bullish, with all other criteria empty (showing “- – -“).

Screen_Shot_2020-05-01_at_1.25.58_PM.png

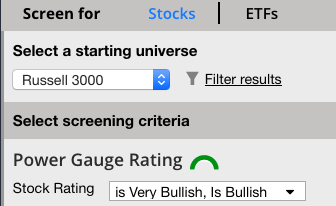
The button to run a screen will say Get Results indicating a screen has yet to be run.

Screen_Shot_2020-05-01_at_1.25.17_PM.png

Adding Screening Criteria

Use the menu drop-downs to select values for criteria, or set them to empty.

Performing a Screen

When you are ready, press Get Results to generate a list of stocks in the Stock Universe matching the criteria you have specified. Stocks must meet all specified criteria to be included; empty criteria do not affect the screen. Results will display in the Results window to the right.

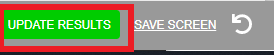
Once the Screen has been performed, the SCREEN button will switch GREY and the dialogue will change to Update Results.

Changing Criteria

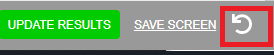
Once Results are displayed, you can change criteria without losing your current Results display. When the first setting is changed, the 'Update Results' button will turn GREEN again, indicating that you can press it to generate new Results.

mceclip0.png

Resetting the Screener

You can reset the Screener to its default state at any time by pressing “Reset Icon“. This will erase any results currently displayed and reset the screener to its default state.

mceclip1.png

Matching Results

When a Screen is run, you will see ‘lozenges’ next to each of the criteria you have set, indicating the successive number of matching stocks, starting with the number of active stocks in the Stock Universe, and applying each of the specified criteria in order from top to bottom. The final number reflects the number of stocks displayed in the Results Window.

Results Window

Once a Screen has been successfully run, Results will be displayed in the Results Window, which is almost identical to that Watchlist’s Panel View. Each stock shows Ticker, Company Name, Power Gauge Rating, Last, and today’s Percent Change

Title Bar

The Results Title Bar shows the number of matching Results, a Power Bar indicating their Bullish/Neutral/Bearish breakdown, a Sort By drop-down, and a 'View in Workspace' button and 'Save Results' button.

mceclip3.png

Results Hotlink

Once you have successfully run a Screen which has generated matching results, select “View in Workspace” to quickly see these stocks in the Watchlist. This will create a working list called “Screening Results“.  This list will be overwritten the next time you use this function unless you rename the list. You may use "Save Results" to create a new user list which will not overwritten or deleted by the system. 

Screen_Shot_2020-05-01_at_1.31.34_PM.png

Sort By

By default, Results will be sorted alphabetically. As in the Watchlist, you can sort alphabetically, by Power Gauge Rating, or by today’s Percent Change, all either ascending or descending. When sorted by Percent Change, today’s advances will be colored GREEN, and declines will be colored RED.

Large Results Lists

The Chaikin Analytics Screener can generate Results lists of any size, though you may see less than optimal browser performance when displaying large lists. To account for this, if there are more than 500 matching Results, the application will display the first 500 alphabetically, and then prompt you whether you want to load remaining results. Press Continue to display all Results, or Cancel to see only the first 500.

Save Results & View in Watchlist

Enter a name for this list, and press Continue to save.

If you select “View in Watchlist”, the application will automatically switch to the Workspace, displaying this list in the Watchlist upon saving. This is a very convenient way to see the quality of this Screen.

Select Screener from the main navigation area again to switch back to the Screener. Your Screening Criteria and Results will be maintained, so you can try different Screening ideas in succession and see their impact on Results.

Save Your Screen

You have the option to save your screen definitions so you can retrieve them later for reuse. Screen definitions may also be deleted. To save time, you can duplicate an existing definition, modify it, then save it.

Saving a Screen

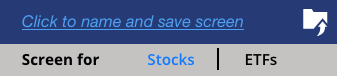
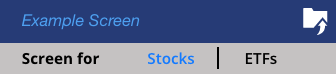
When you first enter the Screener, the screen is in its default state and is untitled.

Screen_Shot_2020-05-01_at_1.42.42_PM.png

Once you set some screening criteria and screen for stocks, the Save icon turns white indicating you may save your screen, should you decide you want to.Screen_Shot_2020-05-01_at_1.42.23_PM.png

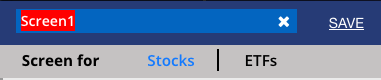
To do so, simply enter a name for your screen in the name field, shown as “click to name and save screen” to start, and press return.

Screen_Shot_2020-05-01_at_1.44.42_PM.png

If a screen of that name already exists, you will have the option to replace it or cancel.

Loading a Screen

Your saved screens are shown under the Save Screen popup menu, which you access by clicking the menu arrow button next to the Save Screen folder. Then by clicking “Saved Screens” to see your list.

Screen_Shot_2020-05-01_at_1.39.42_PM.png

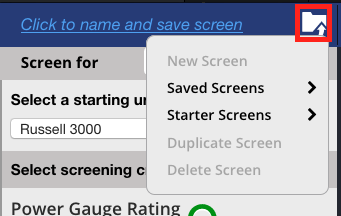
To load a screen, simply click on the one you want to load. After you do so, the screener will refresh with that screen’s name and criteria. You may then execute it, modify it, delete it, or reset it.

Starter Screens

Accessed the same way you access a Saved Screen. Instead click Starter Screens.

Deleting a Screen

To delete a screen, first you must load it, using the process above. Then select Delete Screen from the screener menu. You will have the option to continue or cancel.

Using One Screen as the Basis for Another

You can save time by using one screen as the basis for another. To do so, first create the base screen and save it. Then use the “Duplicate” command on the screener menu to make a copy of it.

The resulting screen will have the same name with a number attached at the end. Edit the name if you like, make any modifications you want to make in criteria. Then select “Save Screen” from the screener menu to save the changes you made.

Screening Criteria

The Chaikin Analytics Screener is designed to allow flexible combinations of various criteria, focusing on Chaikin’s most high-value analytical tools: the Chaikin Power Gauge Rating, its Components and Factors, Industry Rating, Stock Performance, and selected Technical Indicators, Signals, and Fundamental fields.

Fundamentals are primarily represented in Power Gauge Factors – we are not attempting to provide an open-ended Fundamental data screener.

Stock Universe

First, select a starting Universe which best represents the stocks you want to screen for.
 Screen_Shot_2020-05-01_at_1.49.03_PM.png

The default will be the Russell 3000 stocks. Other choices are as follows:


All Rated Stocks

All active stocks in the Chaikin Analytics system with a valid Power Gauge Rating

Russell 3000

All stocks in the iShares Russell 3000 ETF (IWV). These include large, mid, and small cap stocks covering about 98% of the total market value of U.S. listed companies.


(Note: for various reasons there may not be exactly 3000 stocks in the Russell 3000 list).

SP500

All stocks in the SPDR SP500 ETF (SPY). These are the 500 largest cap stocks listed on U.S. exchanges as determined by Standard & Poors.


(Note: for various reasons there may not be exactly 500 stocks in the SP500 list).

Growth Stocks

All stocks in the iShares Russell 3000 Growth ETF (IUSG).

Value Stocks

All stocks in the iShares Russell 3000 Value ETF (IUSV).

Large Cap Growth

All stocks in the iShares Russell 1000 Growth ETF (IWF).

Large Cap Value

All stocks in the iShares Russell 1000 Value ETF (IWD).

Small Cap Growth

All stocks in the iShares Russell 2000 Growth ETF (IWO).

Small Cap Value

All stocks in the iShares Russell 2000 Value ETF (IWN).

Strongest Industries

Stocks in the top 20% of S&P's Groups, as determined by Chaikin Power Bar Score. Industries without a positive Bullish/Bearish balance are excluded, even if in the top 20%.

 (This generally reflects the top 12 items in the Industries section of the List Navigator, when sorted by Rating).

Weakest Industries

Stocks in the bottom 20% of S&P’s Industry Groups, as determined by Chaikin Power Bar Score. Industries without a negative Bullish/Bearish balance are excluded, even if in the bottom 20%.


(This generally reflects the bottom 12 items in the Industries section of the List Navigator, when sorted by Rating).

Select an Industry…

Select a specific Industry Group as your starting Universe.

Select a Sector…

Select one or more of the 11 SPDR Sector ETFs as your starting universe.

Select a Subsector….

Select one or more of the 22 SPDR Subsector ETF’s as your starting universe.

Select a User List….

Select a User List as your Stock Universe.  Note that a User List will not be available for screening until 24 hours after it was loaded. 

Global Filter

The Global Filter allows you to exclude certain stocks from your work in Chaikin Analytics based on minimum price, liquidity, market capitalization criteria and optionable status.

mceclip4.png

The Filter icon indicates the state of the Global Filter (blue = On, grey = Off).

Click the Filter icon to edit Global Filter Settings and turn it on or off.

By default, the Global Filter is On, and will exclude stocks where any of the following is true:

  • Previous Close < $3
  • 20-day Avg Volume < 25,000 shares
  • Market Cap < $50 million
  • Stock is not optionable

You can change these settings and click Save to apply them.

The same settings apply in the Watchlist and the Screener. Any changes you make in either place will apply in both.

If the Global Filter is On when you run a Screen, its criteria will be applied to the Starting Universe before Screening Criteria are applied. That is, only results that also pass your Global Filter settings will appear.

Rating Criteria

In the Rating section, you can set Screening Criteria for a stock’s Power Gauge Rating, and up to 3 Power Gauge Components or Factors.

Power Gauge Criteria

The Power Gauge Rating menu allows you to screen for stocks whose Power Gauge Ratings meet certain criteria.

All Power Gauge Rating criteria look at the “corrected” Power Gauge Rating, with the Technical Overlay applied.

Here the choices for the Power Gauge Rating that may be used in the Screener.  You may select to Screen on current rating, Rating Change, or Rating Persistency.

mceclip0.png


Power Gauge Components and Factors

Power Gauge model.

You can select up to 3 Components or Factors to include in your Screening Criteria, and specify a value for each.

If the value is empty, the Factor will not be included in the screen.

The menus default to 3 of the most heavily-weighted factors in the model.

Component or Factor Includes Stock if…
(empty)
is Very Strong Component or Factor is in the top quintile today
is Strong Component or Factor is in the 2nd quintile today
is Neutral Component or Factor is in the 3rd quintile today
is Weak Component or Factor is in the 4th quintile today
is Very Weak Component or Factor is in the bottom quintile today
turned Strong today Component/Factor was not Strong yesterday but is Strong today
turned Strong this week Component/Factor was not Strong at end of previous calendar week but is Strong today
turned Weak today Component/Factor was not Weak yesterday but is Weak today
turned Weak this week Component/Factor was not Weak at end of previous calendar week but is Weak today
big gain this week Component/Factor had a significant gain from end of previous calendar week to today
big loss this week Component/Factor had a significant loss from end of previous calendar week to today

Note: It is technically possible to make multiple statements about a Factor which may be contradictory. This is not prevented, but will lead to 0 Results.

Performance Criteria

In the Performance section, you can set criteria based on a stock’s price return over time, on an absolute basis and relative to the SPY (SP500 ETF, which closely tracks the SP500 index).

For the Price Return criteria, select a time frame and a minimum percent return Up or Down over the period – or find stocks at-or-near their high or low for the period.

You can make two statements about Price Return. This can be useful, for instance, to find stocks which are up 20% Year-to-Date, but down 5% within the last month (“High Flyers with Pullbacks”).

For Return vs SPY, select a time frame and an amount by which the stock must have either outperformed or underperformed the SPY over the period.


Up… Description
At/near high Most recent closing price is greater than or equal to the highest closing price for the previous (1 week, 1 month, 3 months, 6 months, 1 year, current year-to-date).


All except “1 week” have a 2% tolerance.

At/near low Most recent closing price is less than or equal to the lowest closing price for the previous (1 week, 1 month, 3 months, 6 months, 1 year, current year-to-date).


All except “1 week” have a 2% tolerance.

Up… Most recent closing price is at least (2%, 5%, 10%, 20%, 50%) greater than closing price (1 week ago, 1 month ago, 3 months ago, 6 months ago, 1 year ago, at end of prior calendar year).
Down… Most recent closing price is at most (2%, 5%, 10%, 20%, 50%) less than closing price (1 week ago, 1 month ago, 3 months ago, 6 months ago, 1 year ago, at end of prior calendar year).

Note: It is technically possible to make multiple statements about Price Return which are contradictory. This is not prevented, but will lead to 0 Results.

Return vs. SPY Description
Up… Percent change of stock’s closing price is at least (2%, 5%, 10%, 20%, 50%) greater than percent change of SPY’s closing price over (1 week, 1 month, 3 months, 6 months, 1 year, current year-to-date)
Down… Percent change of stock’s closing price is at most (2%, 5%, 10%, 20%, 50%) less than percent change of SPY’s closing price over (1 week, 1 month, 3 months, 6 months, 1 year, current year-to-date)
 

Technical Criteria

In the Technicals section, set criteria for current Price levels, various indicators included on Chaikin Analytics charts, and Relative Volume.

Price Level

You can select up to 2 criteria for Price Level.

Menu Selection Description
Price Level Overbought Closing price is high in its short-term range. OB/OS is greater than or equal to 70.
Oversold Closing price is low in its short-term range. OB/OS is less than or equal to 30.
Above Rising LT trend Closing price is above its long-term trend (DEMA); trend rising over last 3 months, and last 5 days.
Below Falling LT trend Closing price is below its long-term trend (DEMA); trend is falling over last 3 months, and last 5 days.
Near Upper Band Closing price is within 2% of its Upper Chaikin Band (above or below).
Above Upper Band Closing price is greater than or equal to its Upper Chaikin Band.
Near Lower Band Closing price is within 2% of its Lower Chaikin Band (above or below).
Below Lower Band Closing price is less than or equal to its Lower Chaikin Band.
Above EMA 21 Closing price is greater than its 21-day Exponential Moving Average (EMA21).
Below EMA 21 Closing price is less than its 21-day Exponential Moving Average (EMA21).
Above DEMA Closing price is greater than its 200-day Double Exponential Moving Average (DEMA). Also: Chaikin Trend, long-term trend.
Below DEMA Closing price is less than its 200-day Exponential Moving Average (DEMA). Also: Chaikin Trend, long-term trend.
Crossover EMA21 today Closing price was less than or equal to EMA21 yesterday and Closing price is greater than EMA21 today.
Crossunder EMA21 today Closing price was greater than or equal to EMA21 yesterday and Closing price is less than EMA21 today.
Crossover DEMA today Closing price was less than or equal to DEMA yesterday and Closing price is greater than DEMA today. Also: Chaikin Trend, long-term trend.
Crossunder DEMA today Closing price was greater than or equal to DEMA yesterday and Closing price is less than DEMA today. Also: Chaikin Trend, long-term trend.

Money Flow

Menu Selection Description
Money Flow Very Strong Chaikin Money Flow is greater than or equal to 25
Strong Chaikin Money Flow is greater than or equal to 5
Weak Chaikin Money Flow is less than or equal to -5
Very Weak Chaikin Money Flow is less than or equal to -25
1 mo high persistency Chaikin Money Flow was greater than 0 70% of the last 20 trading days
1 mo low persistency Chaikin Money Flow was less than 0 70% of the last 20 trading days
3 mo high persistency Chaikin Money Flow was greater than 0 70% of the last 60 trading days
3 mo low persistency Chaikin Money Flow was less than 0 70% of the last 60 trading days
6 mo high persistency Chaikin Money Flow was greater than 0 70% of the last 120 trading days
6 mo low persistency Chaikin Money Flow was less than 0 70% of the last 120 trading days

Relative Strength

Menu Selection Description
Rel Strength Very Strong Chaikin Relative Strength is greater than or equal to .8
Strong Chaikin Relative Strength is greater than or equal to .6
Weak Chaikin Relative Strength is less than or equal to .5
Very Weak Chaikin Relative Strength is less than or equal to .2
1 mo high persistency Chaikin Relative Strength was greater than .5 70% of the last 20 trading days
1 mo low persistency Chaikin Relative Strength was less than .5 70% of the last 20 trading days
3 mo high persistency Chaikin Relative Strength was greater than .5 70% of the last 60 trading days
3 mo low persistency Chaikin Relative Strength was less than .5 70% of the last 60 trading days
6 mo high persistency Chaikin Relative Strength was greater than .5 70% of the last 120 trading days
6 mo low persistency Chaikin Money Flow was less than 0 70% of the last 120 trading days

Relative Volume

Menu Selection Description
Relative Volume Very Heavy 9 day average volume is greater than or equal to 2 times 90 day average volume
Heavy 9 day average volume is greater than or equal to 1.5 times 90 day average volume
Light 9 day average volume is less than or equal to .5 times 90 day average volume
Very Light 9 day average volume is less than or equal to .25 times 90 day average volume

Note: In all cases above “Today” refers to the most recent Trading Day for which market data is available.


Min/Max Price

Select minimum and maximum values for closing price.

Screen_Shot_2020-05-01_at_1.51.38_PM.png

Fundamental Criteria

In the Fundamentals section, select criteria related to Market Cap, Dividend Yield, and Earnings Date.

Other Fundamental fields may be represented as Factors in the Rating Criteria section.

Menu Selection Description
Market Cap Micro Cap Market Cap is less than $300 million
Small Cap Market Cap is between $300 million and $2 billion
Mid Cap ($2b – $10b) Market Cap is between $2 billion and $10 billion
Large Cap (> $10b) Market Cap is at least $10 billion
Small & Mid Cap Market Cap is between $300 million and $10 billion
Mid & Large Cap Market Cap is at least $2 billion
Div Yield Positive Dividend Yield > 0
1%-5% Dividend Yield is at least (1%, 2%, 3%, 4%, 5%)
Earnings Date Today/Yesterday Company reported Earnings either yesterday or today*
Tomorrow Company reports Earnings tomorrow
Within the next week Company reports Earnings within the next 7 days
Within the past week Company has reported Earnings within the last 7 days.
Beta Low < 1 Lower volatility than the market (S&P500)
=>1 and <=2 Voltatily at the market or moderately higher
High >2 Much higher volatility than the market (S&P500)

*Earnings report dates are updated nightly, and indexed for Screening before each market open. When a company reports during the day, its “Last Report Date” and “Next Report Date” will be updated to reflect this in the Screener the following day. All dates are current calendar day, Eastern U.S. time.

In Chaikin Analytics, the fundamental fields we have found to be predictive to future intermediate-term relative price performance are included in the Power Gauge model. Factors are normalized to either the stock’s Industry Group or the Russell 3000, based on our backtesting.

Signals

In the Signals section, screen for stocks which have had Chaikin Buy or Sell Signals within the last week.


Was this article helpful?

Can’t find what you’re looking for?

Our award-winning customer care team is here for you.