The Chaikin Power Gauge Rating is the centerpiece of Chaikin Analytics—it’s a remarkably accurate indicator of where a stock is headed over the next 3 to 6 months.
This page is the entry into the section of the Chaikin Analytics platform where you can:
- Quickly see ratings on any of the 5000+ stocks or 2000+ETFs that we rate
- Dive into our Chaikin Hotlists to see top stocks as rated by our Power Gauge rating and refreshed daily
- Launch into our full Company page, ETF page, or 20-Factor Stock Report to get more detailed analysis on any symbol.
Quick Rating
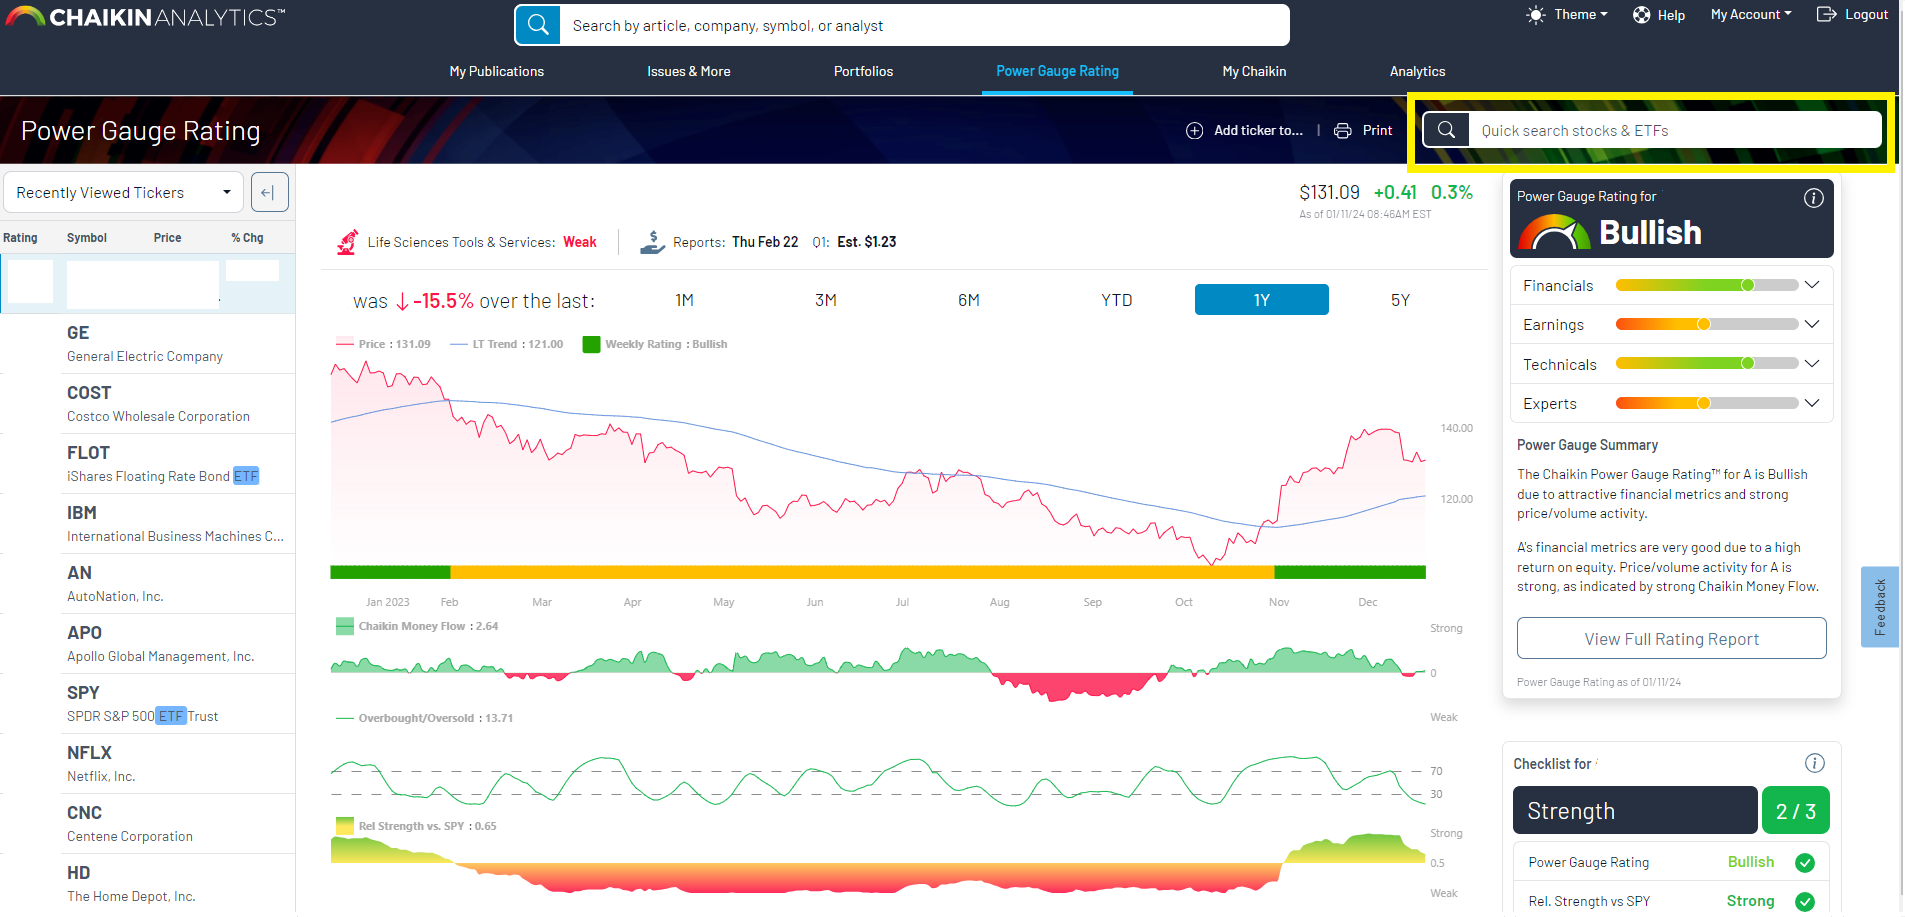
Simply type any symbol to see the Chaikin Power Gauge Rating and quick overview. Note, this will only refresh the quick rating. To get the full detail, you can click on the symbol to get to the company or ETF page, or click the “View Full Rating Report” to get to the 20-Factor Rating analysis for any stock.
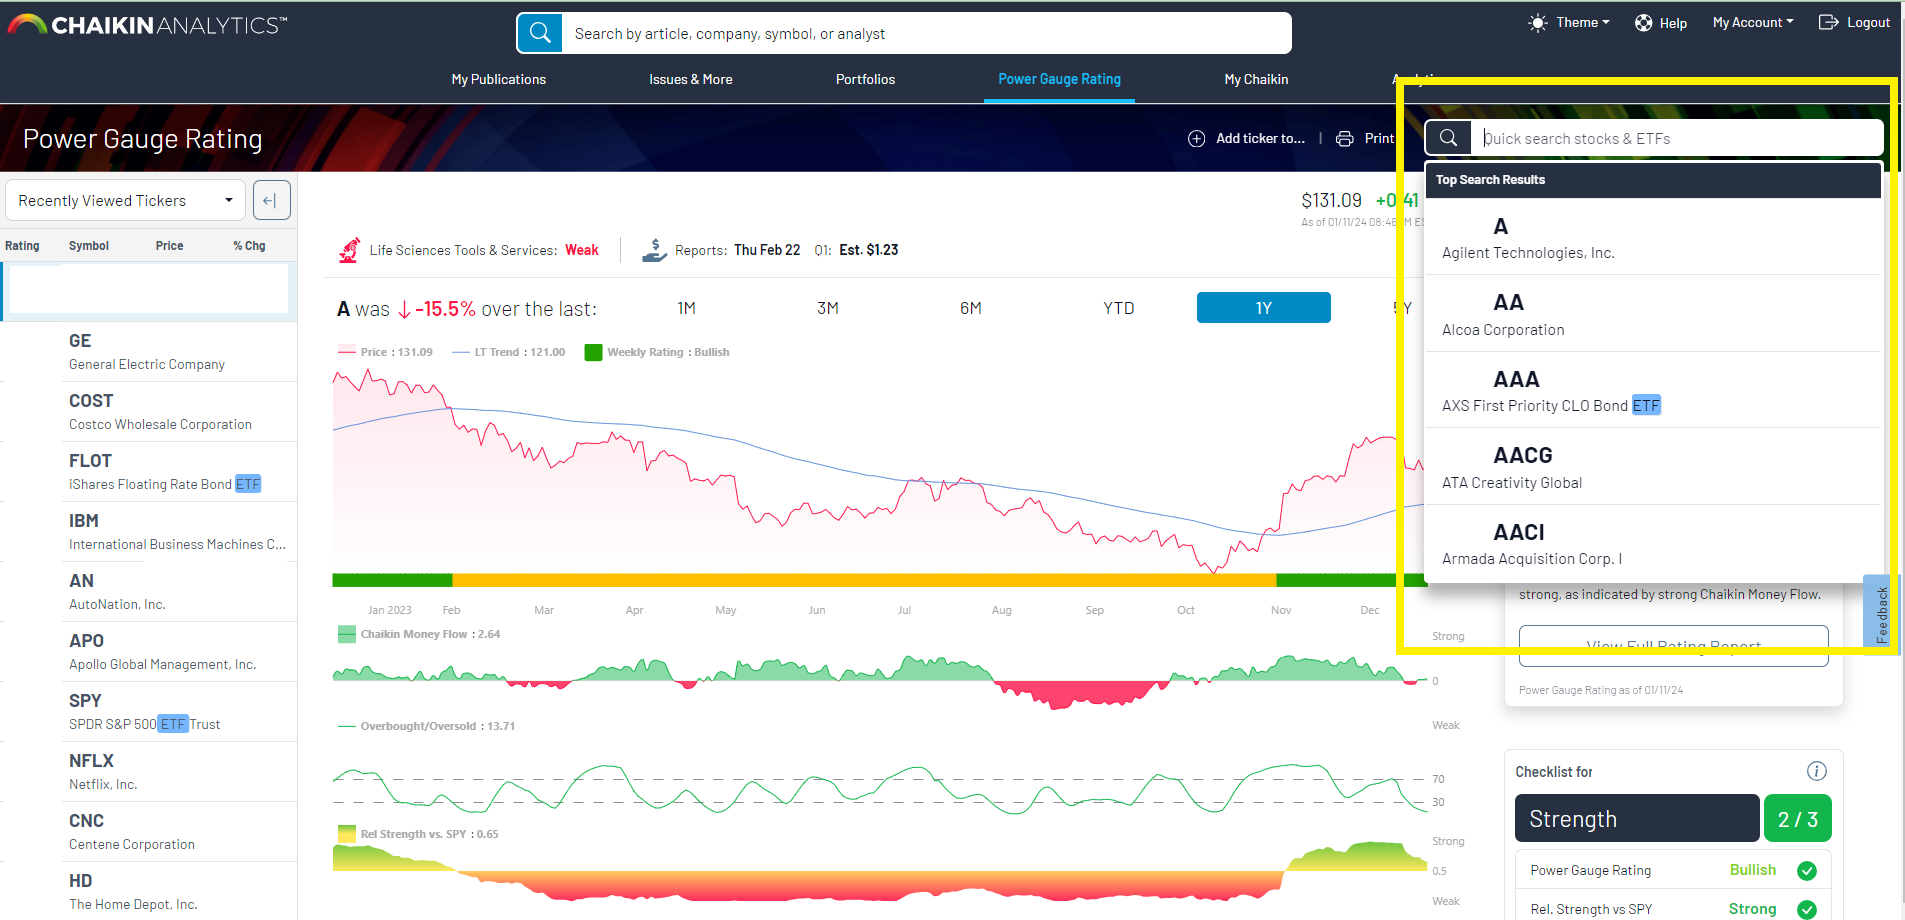
When Searching for a security you'll often see an S or E symbol. These symbols represent that type of security. S for Stocks and W for ETFs.
The Chaikin Power Gauge Rating
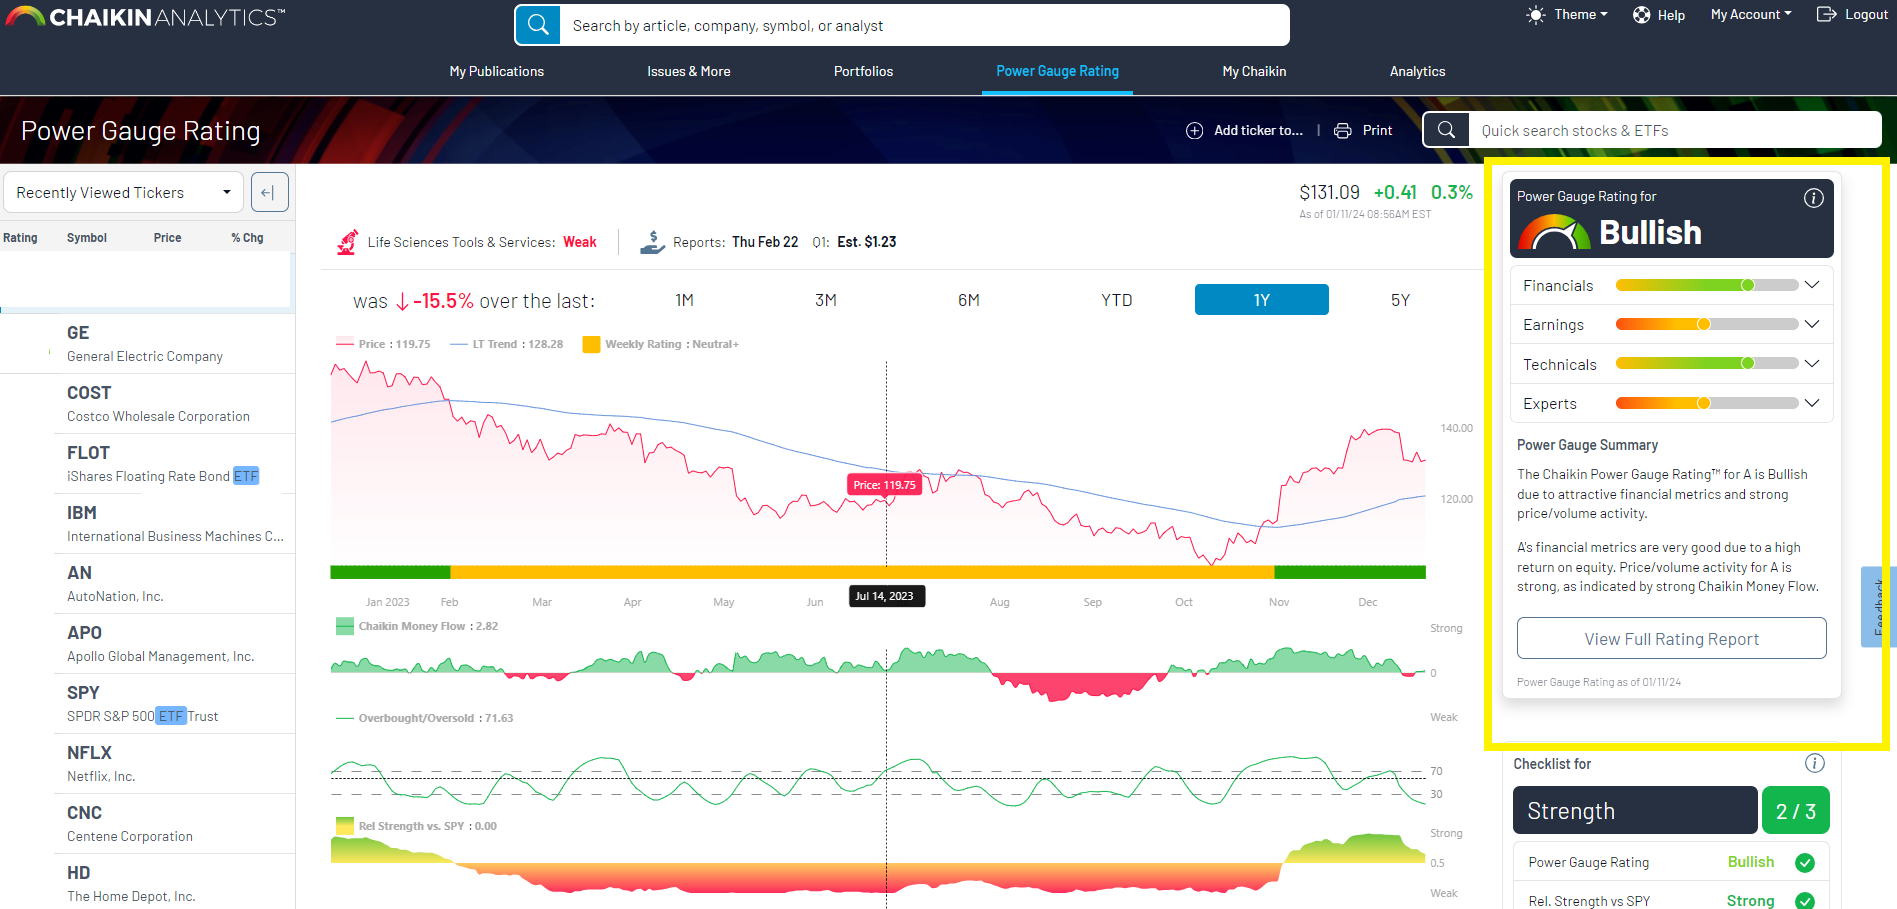
The first thing on the page is a quick overview of the Chaikin Power Gauge Rating. This includes the overall rating, as well as the rating for the individual four categories: Financials, Earnings, Technicals, and Experts.
Click here for in-depth information about the Chaikin Power Gauge Rating.
For a detailed 20-Factor Report on the stock, click the “View Full Rating Report” button under the summary text. You can also get more information about the Chaikin Stock Rating Report here.
The Chart and Chaikin Indicators
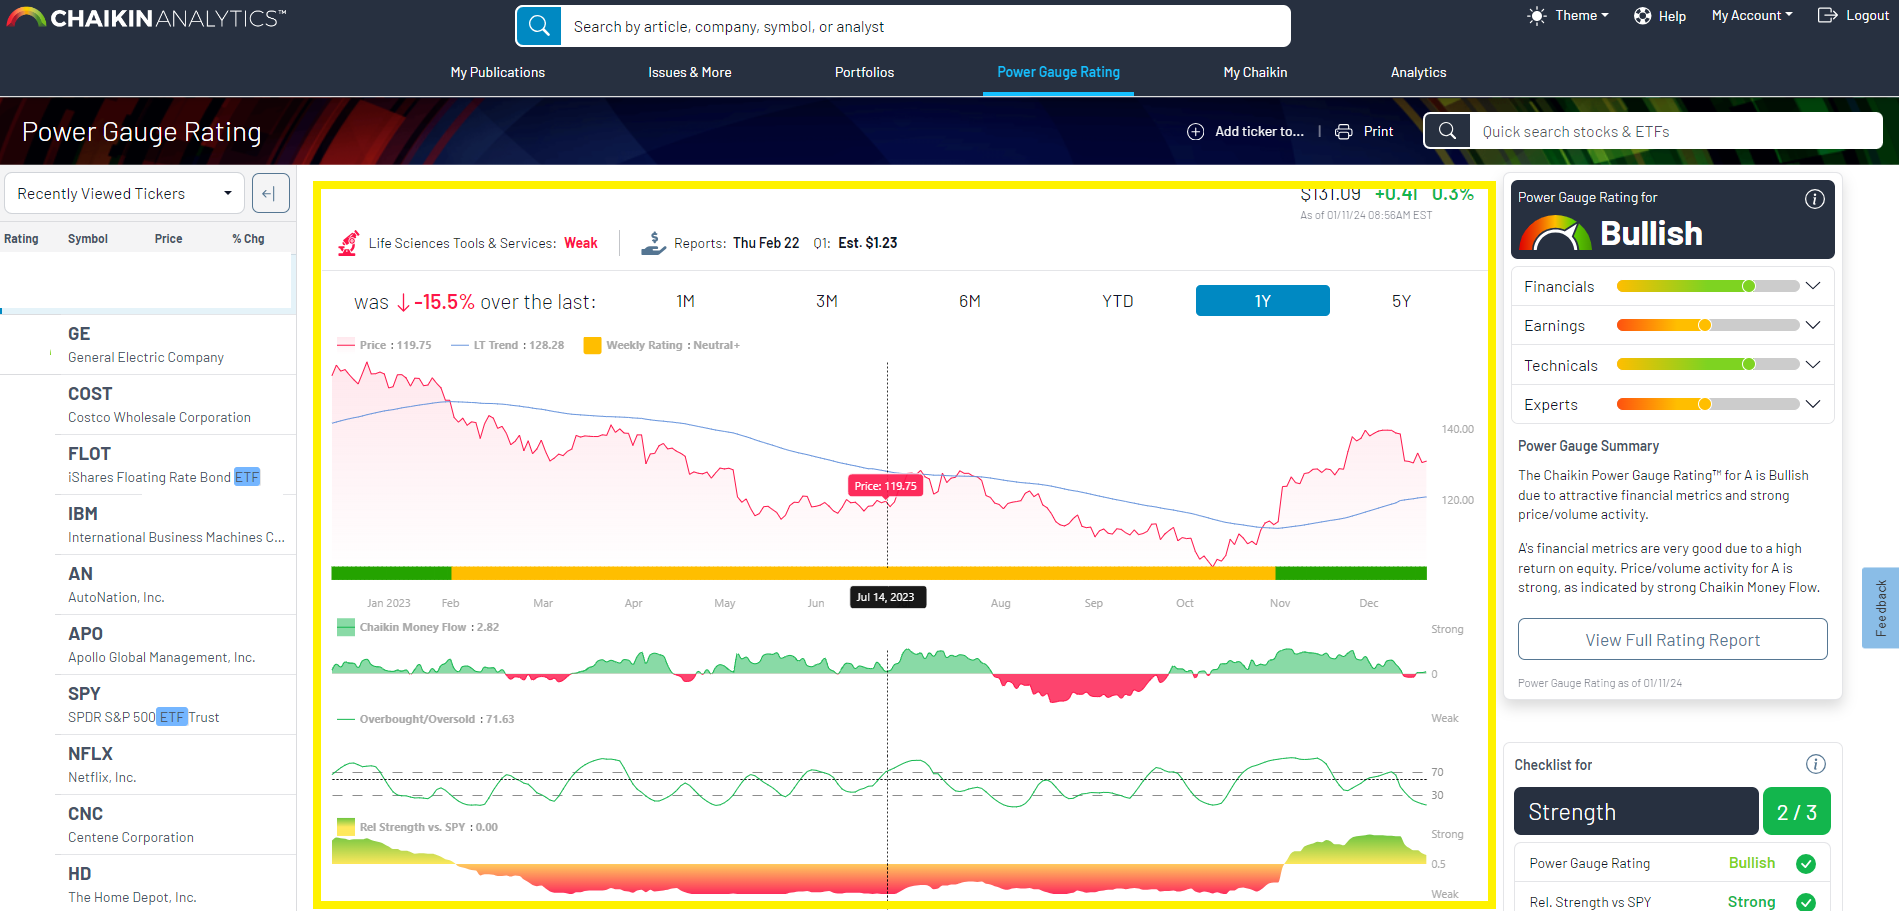
In addition to the Power Gauge Rating is a simple chart showing close prices and Long Term Trend with 4 key indicators. The default selection is 1 year.
Price Chart: The price chart displays the stock's closed price for the corresponding trading day. Weekends and holidays when the market is closed are not included in the chart.
The chart displays in green if the price change over the time selected is positive and red if it is negative. Hover over the chart on desktop, or drag your finger on mobile to see specific closing price values and dates.
The blue line that cuts across the chart is the Long Term Trend (LT Trend) which is a 200-day Double-Exponential Moving Average that gives a sense of the long-term price direction.
Indicator 1: Weekly Rating History Bar: Below the chart is a weekly historical rating summary, which shows the rating trend of the stock at the close of each corresponding week. This helps to visualize the trend of the rating over time.
Indicator 2: Chaikin Money Flow: Chaikin Money Flow is a proprietary measure of net accumulation (green) or distribution (red). This is a simple, effective way of including volume in your analysis, and has become an industry standard tool.
Indicator 3: Overbought/Oversold: This indicator provides a smoothed, scaled cyclical indication of where a stock is in its normal trading range
Indicator 4: Relative Strength vs SPY: This indicator provides a consistently scaled indication of a stock’s recent performance relative to the S&P 500. When the gradient gets to green, this indicates the stock has been strongly outperforming the market.
See more information on the Chaikin Indicators here.
The Pre-Trade Checklist
While there is no substitute for reading patterns and trends on the chart yourself, the Stock Checklist is designed to be your guide to the Chaikin Analytics chart and indicators, which are designed to be used in conjunction with each other. They are:
Strength
- The Power Gauge Rating (What does our model say about the stock?)
- Rel Strength vs SPY (What does the market say?)
- Industry Strength (Will this stock get tailwinds due to an overall industry lift or the opposite?)
Timing
- Overbought/Oversold (Is it time to enter from a short term perspective?)
- Long Term Trend (Is this stock in a sustained technical uptrend?)
- Chaikin Money Flow Persistency (What does “Smart Money” say?)
If all of the checklist indicators are green, the weight of the evidence points to the likelihood this stock will outperform in the coming months. The fewer indicators that are green, the less likely for a positive outcome.
Click here for more information about the Pre-Trade Checklist.
List View
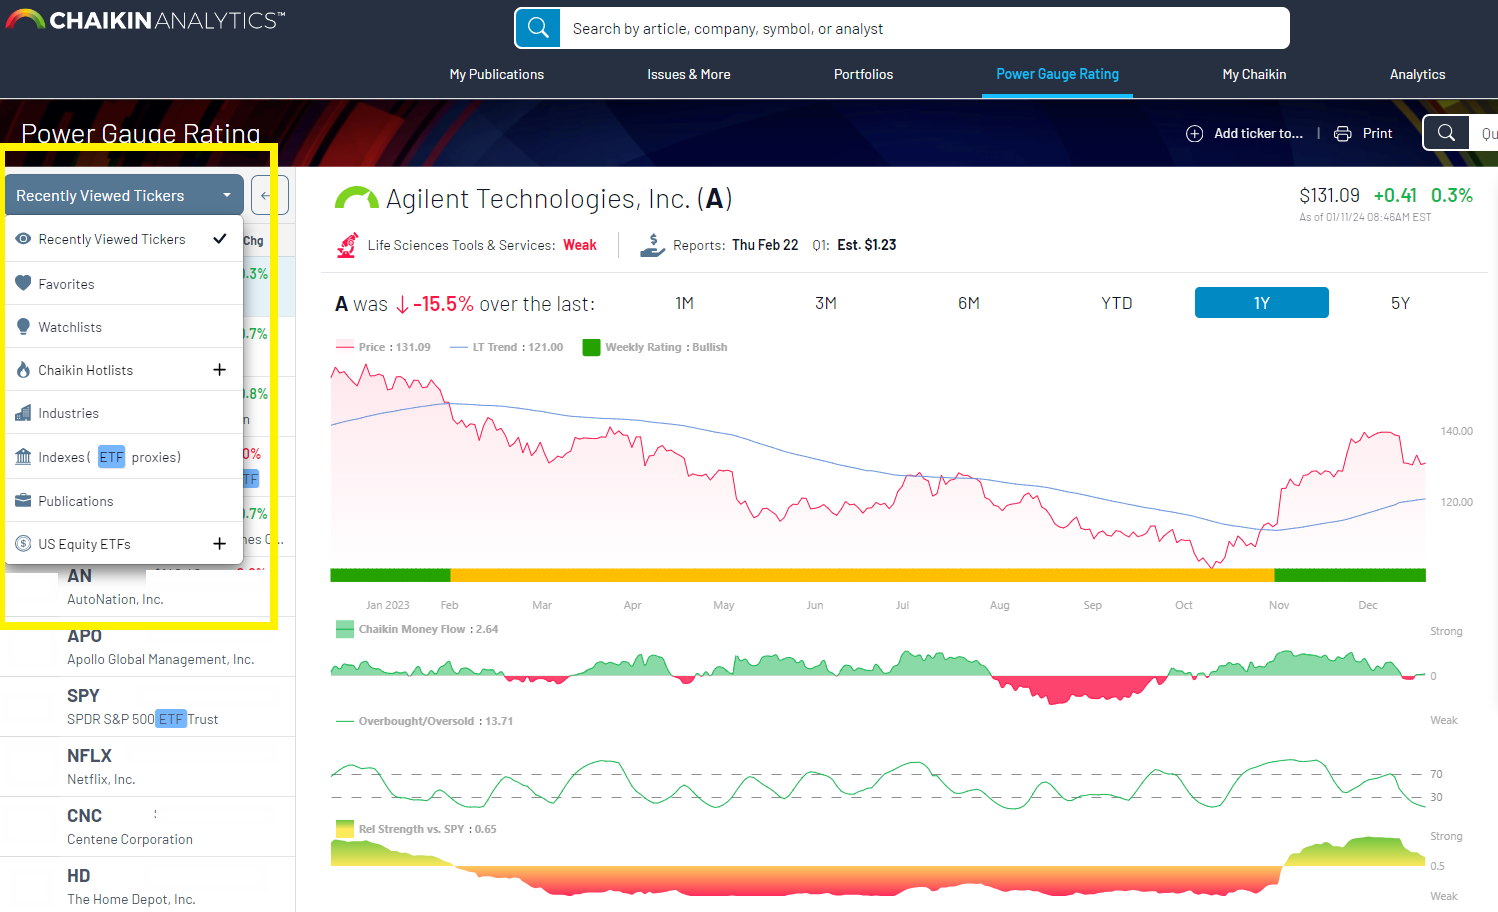
The Company and ETF pages now have a list navigator menu to the left of the Power Gauge detail.
- This defaults to your Recently Viewed, but you can select a new list by clicking the dropdown to the right of “Recently Viewed” to select your desired list type
- Once your new list type is selected, all lists within that list type will load into the menu, with the first list auto-expanded to show the tickers. Simply click the arrow to the right of the list's name to collapse the list and select a new list to be expanded.
The list menu features some of Chaikin Analytics most helpful resources like Chaikin Hotlists, Industries and US Equity ETFs. You can learn more about our Chaikin Hotlists in the Hotlist Section of our help center here.
Other Ideas or Lists
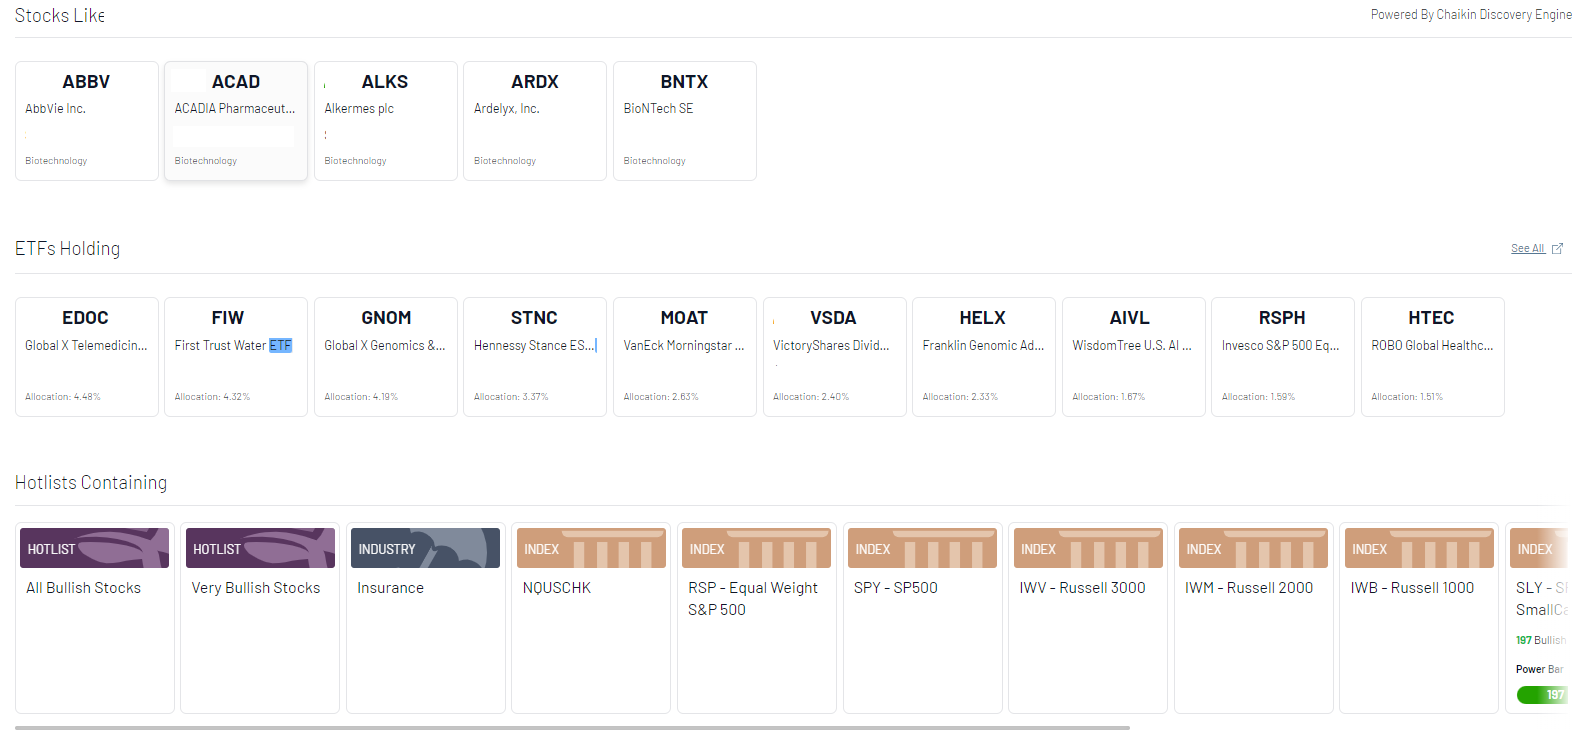
If you like something about the selected stock but want to either diversify with an ETF or find similar stocks that match specific criteria, you can take a look at the following three areas of the page:
- ETFs holding - Find the ETFs with the highest allocation of this stock while also holding other equities.
- Stocks Like - Powered by our Discovery Engine, this shows the top 5 stocks that are most closely related to the selected stock.
- Hotlists Containing - If the stock appears in a Chaikin hotlist, you will see it listed here so you can see other stocks that are the same list.
Please Note
The List View and Pre-Trade Checklist are only available with the the Power Pulse Premium software level or higher. The Other Ideas is only available with the Power Gauge Analytics software level or higher.
More about the Power Gauge Rating
Finally, the page also provides a quick overview of the Power Gauge Rating. To see even more detail about our rating, see other topics in our Knowledge Center here.